PREVIEW DRAFT
October 6, 2026 · updated October 7, 2026
ⱣOWERŦIME: a novel societal technology
Abstract
ⱣOWERŦIME is societal technology that lets a group govern itself. The group decides by pooling its members’ judgment. New game-theory mechanics turn that judgment into alignment, coordination and cooperation, so that members act together and help each other accomplish shared goals. Politically, it is neither democracy nor dictatorship. Economically, it is neither capitalism nor socialism. Instead, we start from first principles and the position that although organization is our species’ greatest strength, it can still be much better than it is. ⱣOWERŦIME is a radical update to how people organize. Its goal is to deliver the greatest good for the most people, as judged by those people themselves. That goal is also the metric ⱣOWERŦIME optimizes for.
We benchmarked ⱣOWERŦIME with simulated people and compared the results with the same people working in hierarchies, where each person answers to a boss. The hierarchy is modelled, while the core mechanics of ⱣOWERŦIME are run on the actual system rather than a model. On the main metric, the greatest good as people judge it, ⱣOWERŦIME leaves hierarchy far behind. A voting bloc of any size from 5% to 50% of members costs ⱣOWERŦIME at most 3% of the attainable welfare when at least three-quarters of the usual turnout votes, 5% at half and 11% at a quarter, against 64–68% under hierarchy’s concentrated voting weight (means of 32 simulated realms of 150 people; at three-quarters turnout or more, the middle half of realms loses at most 5.4%). ⱣOWERŦIME also resists tyranny, whether a minority or a majority attempts it. And people get more done while working less. ⱣOWERŦIME produces 2.5 times a well-run (benign) hierarchy’s output per person and 3.6 times a typical one’s at 150 people, rising to 3.3 and 4.7 times at 100,000. Governance takes 9% of working hours instead of 22%, and make-work about 2% of the wage bill instead of about 4%.
What ⱣOWERŦIME delivers
- 2.5 to 4.7 times the output per person. ⱣOWERŦIME produces 2.5× a well-run hierarchy’s output per head and 3.6× a typical one’s at 150 people, and 3.3× and 4.7× at 100,000 (§7).
- Less work. Governance takes 9% of working hours against a hierarchy’s 22% (§6.9); make-work wastes 1.4–2.0% of the wage bill against 3.5–3.9% (§6.8); and after ten periods dead wood is 4.9–6.4% of members against 12.6–15.5% of staff (§6.7).
- Bigger gets better. The lead grows about 3% each time membership doubles, and by about 7% for each layer of management a hierarchy adds (§7).
- ⱣOWERŦIME firms produce most of the market’s output within a generation. Starting as 5% of firms, they get there in about 6 years against a typical hierarchy and 16 against a well-run one, where people can move between firms, in a market calibrated to how long US firms survive (§7).
- 1.9 to 2.5 times the survival. 54% of new ⱣOWERŦIME firms are still trading after ten years against 29% of the well-run hierarchies they compete with, and 55% against 22% of typical ones: 1.9 to 2.5 times the survival (§7).
- No one can seize it, neither a minority nor a majority. Bribery alone admits no fake members, and the few fakes that get in when bribed members also vote the line are mostly expelled (§5.3). A bloc of up to a third never captured a poll (§5.5). A bloc cannot expel the members who matter, and its campaign costs everyone else at most 2.4% of their stakes (median) (§5.2).
- Fairer pay as it spreads. As adoption rises from none to the whole economy, what a pay grab pays its supporters falls from +16% to +2% where skills are balanced and from +65% to +7% where they are easy to replace (§5.4).
- Everyone engaged, by design. Every member chooses their work and holds a binding say over pay and membership, while today only 20% of employees worldwide are engaged (§1, §6.6).
In simulation, against the hierarchy as modelled in §3.
Glossary
- Realm. One organization running on ⱣOWERŦIME.
- Ᵽ (Power). A member’s voting balance: the same for every member, private, non-transferable and capped. The first vote on any question is free, and each additional vote costs twice the one before (1, 2, 4, … Ᵽ), so n votes cost 2^(n−1) − 1 Ᵽ, in every kind of vote. Nobody sees anyone else’s Ᵽ.
- Heat. The Ᵽ spent beyond free votes per unit of time. We propose it as a live measure of how well a realm serves its members, to be tested in live realms (§4.5).
- Ŧ (Time). The realm’s unit of account, in which it prices and trades its output and pays its members.
- Ŧake. A member’s pay, in Ŧ. Its value tracks the member’s own effort and the realm’s collective effort, not the efforts of other individuals, and every member governs the collective effort equally through review. Ŧakes sum to 100%, so a raise for one member dilutes everyone else, and a leaver’s share returns to the rest in proportion (pro rata).
- Review. A panel vote on one member: induction (admitting them), expulsion (removing them), or a Compensation Review of their Ŧake. It passes when approvals beat rejections, once enough distinct panelists have voted to make a quorum; a tie keeps the status quo.
- Panel. The members who decide a review: up to 8, 16 and 32 from the subject’s rings 1, 2 and 3, topped up to at most 56 by island hops (jumping to a random member not yet visited and drawing from their rings).
- Ring. A member’s ring 1 is everyone with a tie (a connection) into them, ring 2 everyone with a tie into ring 1, and so on. Only ties that are or were mutual count.
- Induction. The review that admits a member; its nominator is recorded and excluded from the panel.
- Write-in poll. A decision among the members it affects. A member’s first vote can create a new option, votes can move on a live anonymous tally, and the poll closes at a random moment that no one knows in advance (a candle close).
- Bloc. A group voting a shared line rather than each member’s own preference.
- Remnant. Everyone outside the bloc who is still a member; the figures label it “everyone else”.
- Well-run (benign) and typical. The two ends of our hierarchy sweep (§3): a firm in the top fifth on management practice, and the median firm. After first use we write well-run.
- Low-friction and high-friction. The two ends of ⱣOWERŦIME’s own sweep (§3.1): many observers who always raise reviews, against few observers who raise few.
- Dead wood. Members or staff who are paid more than they contribute.
- Top. The top of a hierarchy: the manager, or management team, that decides for everyone.
1. Why: a radically different idea
Why now. The organizations people live inside are not delivering what they could. Global employee engagement fell for a second year in 2025, to 20%, and to 22% among managers, while 40% of employees reported a lot of stress the previous day [1]. In 2024, 39% of adults were worried for much of the previous day, five points above 2014 [2] (145,000+ interviews, 144 countries). Over twenty years, people under 25 in the United States, Canada, Australia and New Zealand came to rate their lives 0.86 points lower on a 0–10 scale [3]. In 2023, 19% of young adults had no one to count on, up 39% since 2006 [4]. Across 28 countries, 61% hold a moderate or high grievance against business and government [5]; 70% are hesitant to trust someone with different values, and only 32% expect the next generation to be better off [6]. Politics is fraying with it: 72% of the world’s people now live in autocracies, the most since 1978 [7], and 2024 saw 61 armed conflicts involving a state, the most since records began in 1946 [8]. Yet there are still bright spots: people trust those near them, and dropped wallets come back far more often than people expect [4].
2. Approach
ⱣOWERŦIME has one goal: to deliver the greatest good for the largest number of people, as judged by the people themselves. We measure that goal directly and test it two more ways: tyranny (§5), the way it could fail, with a minority or a majority taking control at everyone else’s expense, and productivity (§6), what better organization can achieve economically.
We built a simulator to measure how different ways of governing perform, and used it to hunt for flaws in the design and in our reasoning. Whenever a result looked too good, we swept the assumption behind it across its full range of values. It is less a simulation than a benchmark: just as a load test drives a server, synthetic members drive ⱣOWERŦIME. The core mechanics are run on the actual system rather than a model. Hierarchy has no single rulebook. Because it is practised in many ways, we model its documented mechanisms and sweep each one across its range, from a well-run firm to a typical one (§3). Members on both sides are modelled as generically as possible: each has preferences, but on most matters knows and cares little. Friction, information and voice enter as effects that organization has on work.
3. Hierarchy as modelled
ⱣOWERŦIME has to beat the hierarchies people actually use. We therefore model the mechanisms that research documents and sweep each one from a well-run end, a firm in the top fifth on management practice, to a typical end, the median firm, reporting our headline results as ranges across the sweep.
3.1 The mechanisms
- Affinity hiring. “Fit” often means rapport over ability [9]. We measure how well hiring picks people whose aims truly match as a correlation, where 1 is a perfect match and 0 is none: 0.42 at the well-run end, the validity of a structured interview, and 0.19 at the typical end, that of an unstructured one [10]. We use interview validity as a stand-in for matching aims.
- Talent ceiling. People avoid hiring those who would outshine them [11], and promotion picks top performers who then become worse managers [12]. The direction is documented; the size of the cap is our assumption. A person’s capacity is capped at 4× (well-run) to 2× (typical) their manager’s, and the caps compound down the tree.
- Effort extraction. Output depends on monitoring effort [13–15]. We assume a single monitor catches loafing with probability 0.6 (well-run) to 0.35 (typical) per review, a range that brackets the .52 reliability of one supervisor’s rating [16].
- Upward-only accountability. Processing information efficiently takes many decision-makers [17], and both forms have them; the difference is whom they answer to. A manager answers to their own manager, whereas a ⱣOWERŦIME panel or poll answers to everyone its decision touches. A manager rewarded for headcount acts on loafing they detect with probability 0.9 (well-run) to 0.6 (typical); supervisors are documented to delay negative feedback [18, 19], though no study measures the rate, so the values are assumed. Each manager who passes information up slants it toward their boss’s goals, by a weight of 0.5 to 0.9; employees are documented to withhold bad news upward [20], and the weight is assumed.
- Management practices, the hierarchy’s best case. Structured practice raises productivity [21], by 17% in a year in Indian textile firms [22]. Good bosses raise output [23], and well-run firms delegate [24]. A practices score of 0.8 (top fifth of firms) to 0.5 (median) improves three things: the direct channels that carry information to the top, the minimum say given to staff far from the top, and the chance that the top audits a useless role. The practices studied, however, were routines for inventory, quality and maintenance, which a realm can adopt too. And the gap between good and bad bosses is the talent ceiling seen from the other side.
3.2 Concentrated voting weight
For decisions we also run the simplest hierarchy: the same poll, but with each member’s vote weighted by their layer in the pyramid as (layer + 1)^(−h) and total weight unchanged. While h = 0 is ⱣOWERŦIME’s rule of equal weight, our headline setting, h = 4, makes voting weight about as unequal as wealth: a Gini of 0.83–0.84, on a scale where 0 means everyone holds the same and 1 means one person holds it all, near US household wealth (0.87 in 2019 [27]) and far above US household income (0.49) [28]. Here too we sweep management practice (managers vote for the middle of their reports’ views) and upward-only accountability (votes pulled toward the boss’s).
4. Methods
4.1 The population
Every trial builds its population the same way. Each person has a hidden interest position that decides both whom they connect to and what they want: people connect mostly to those with similar interests, plus a share of random long-distance ties, forming a “small world” [33]. Ties run one way (A “hears” B). Each person hears 20 others on average (range 15–50 [34]), and each tie is returned with probability 0.5, so about 0.73 end up mutual. Each person holds at most 150 ties. Once the list is full, a new tie pushes out the one used least recently and least often; a pushed-out mutual tie becomes “formerly mutual” and still counts for rings; and a person with a full list may not return a tie.
Homophily, the tendency of connected people to be alike, is calibrated so that attitudes correlate 0.35 across ties, swept 0 to 0.51; people are less alike in attitudes than in demographics [35]. Friends agree on 75% of 47 political questions against 63% for random pairs, a chance-corrected 0.32 (phi 0.34; weak ties 0.24, strong 0.46) [36], spouses correlate 0.60–0.65 on ideology and party [37], and online partisanship gives an upper bound near 0.6 [38]. The target describes how alike connected people are, not why: observational data cannot tell whether people choose like-minded friends or friends grow alike [39].
4.2 Issues and perceived value
Each issue has a reach (how many people care, usually few), an agreement (the share of those who care who are on the majority side) and a per-person intensity, mostly low. Which side a person takes follows their attitude, so it clusters among connected people; whether they care at all clusters too, independently.
4.3 Production and pay
Each member i has a productivity pᵢ, heavy-tailed [42] and independent of their connections (we also run it correlated with connectedness at +0.5 and −0.5). The member chooses an effort eᵢ, and their contribution is cᵢ = pᵢeᵢ. The realm’s output index O = Σᵢ cᵢ is its total contribution per period, measured in the same units as pay and effort, so every term below is in output units per period.
Pay. Member i’s Ŧake share is sᵢ = Ŧakeᵢ/100, and their pay is worth sᵢ·O, because output is priced in Ŧ. Effort costs ½eᵢ². Within one period Ŧakes are fixed, so a member’s best effort is eᵢ = sᵢpᵢ, and output is O = Σᵢ sᵢpᵢ². On its own, pooled pay would return to a member only their own share of what extra effort adds, the 1/N problem of team production [43].
Compensation Review re-ties Ŧake to contribution. Any member can propose a new Ŧake for any member at any time, and the panel that decides it is drawn from the people who see the work (§5.1, §6.2). Ŧakes therefore move toward contributions, sᵢ → cᵢ/O, period after period. A member who expects review is paid, over time, close to what they contribute, so the return to their effort is their own productivity rather than a 1/N share of it. That is why, in ⱣOWERŦIME, loafing is limited by how fast reviews catch it (§6.1), not by how many people share the work.
The value of Ŧ. A better output raises the value of every Ŧ. The realm mints a fixed 1 Ŧ per minute and prices its output in Ŧ, so the value of a Ŧ rises with output as O^η. With a fixed mint, η sits near 1; we sweep it from 0.5 to 1.
Leaving and expulsion. When a member leaves or is expelled, their Ŧake returns to everyone else pro rata, and their contribution leaves with them. The members of their ring 1 cover a replacement share a = 0.5 of it with their own extra work (assumed), and the rest is lost. Net, everyone else gains sₜ·O in returned pay and loses cₜ in lost output and covering work, so removing a member costs the rest of the realm whenever that member contributes more than they are paid. Within a period this is sₜ(O − pₜ²), a loss when pₜ² > O; we call such a member a net producer. Admitting a member works the other way: a nominee with productivity p admitted at Ŧake share t raises everyone else’s pay exactly when t < t* = 1 − O/p², which is the point at which their pay equals their contribution. Production is additive, with no complementarity or returns to scale.
4.4 Panels
A panel is drawn outward from one member, its seed, through the seed’s inbound rings: 8, 16 and 32 seats, then island hops up to 56 or the size of the realm, whichever is smaller, excluding the proposer. An induction is seeded on the nominator, since a nominee has no connections yet; Compensation Reviews and expulsions are seeded on their subject. At N = 150 a panel seats 56 (37% of the realm), 98–100% of them from rings 1–3 whether people hear 8 others or 50. At N = 300 it seats 56 (19%), just as local, while at N = 40 it seats 38, 95% of the realm: the panel is the realm. Figure 1 shows where an expulsion’s cost lands.
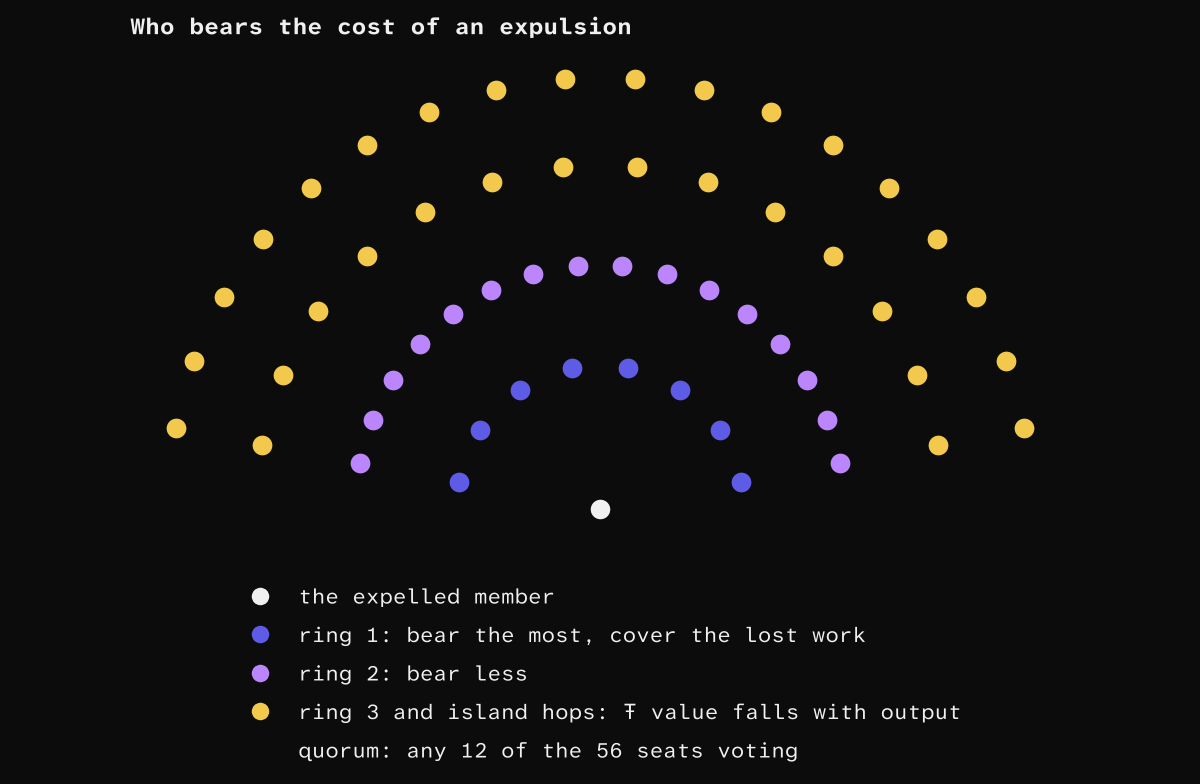
Figure 1. Who bears an expulsion, and who judges it (illustrative, N = 150). The cost of losing a member falls most on ring 1, which covers their work, less on ring 2, then realm-wide as lost output. The panel seats 8 + 16 + 32 = 56 from rings 1, 2 and 3, with ring 3 topped up by island hops; quorum is 12 votes.
Ring 1 judges from experience, while outer rings rely on ring 1’s judgment, which gets noisier with each step out, so they demand more evidence. Near rings are informed but biased, far rings impartial but less informed, and the balance between them is the oversight. Most panelists abstain. A panelist’s chance of voting rises with what they know, which falls ring by ring, and with how much they care: ring 1 holds 14% of seats yet casts 41% of votes. Quorum is 50% of a panel of 10 or fewer, 33% up to 50, and 20% above. A matter for the whole realm, such as changing the realm’s level, is a review with the whole realm as its panel.
4.5 Voting and the welfare score
Every vote is an auction. Tallies are live and the close comes at a random moment, so nobody can win with a last-second bid [44]. The rule is “I vote 1, you vote 1, and we keep going until one of us accepts it is not worth it.” That is a war of attrition at doubling prices [45, 46]: a contest where everyone pays what they bid, win or lose, and the side that values the outcome more wins more often [47]. Escalation is bounded: Ᵽ is capped and cannot be bought, transferred or saved beyond the cap, and one budget serves every issue. Ᵽ is therefore opportunity-cost voting: a vote’s real price is what it costs the member on their other issues, so how members spend shows how much each one cares [48, 49]. In the simulation, the higher-value side wins 29–87% of contested issues as conviction rises from half to fully concentrated on one side, against none under free votes (§6.5). Money can pay a member to vote but cannot buy their votes, since a backer can only pay members to spend their own Ᵽ and can never see whether they did. (In a two-person vote each can infer the other’s vote, which we accept.)
Polls decide matters among the members they affect, and members, not the system, carry out the result. Ᵽ is spent win or lose. In the model, honest members first back the option nearest their own aims and then all switch to the leading option’s strongest rival, except a share who fail to coordinate (the coordination-failure share, swept from 0 to 1), while the auction decides how much each side spends.
Reviews decide matters about one member, and the system carries out the result. Panelists vote for or against, with REJECT always available. Each panelist rations their budget across the reviews still to come, spending their remaining budget × this review’s intensity ÷ (this review’s intensity + the intensity still expected). When a minority wins a review, the Ᵽ ratio between the minority and the majority is preserved, so the majority cannot drain the minority by replaying the question: the issue is settled and stays settled.
Turnout. In the turnout experiments an honest member votes on an issue with probability m·(0.2 + 0.8·σ), where σ, from 0 to 1, is how much they care about it and m is the turnout multiplier: m = 1 is the usual turnout, and m = 0.5 means every honest member is half as likely to vote. A bloc always votes.
The welfare score is the yardstick, since it measures the goal (§2). Each member i has an ideal θᵢₐ and a salience σᵢₐ on each issue axis a. The best decision, x, is the salience-weighted centre of the members’ own ideals: xₐ = Σᵢ σᵢₐθᵢₐ ÷ Σᵢ σᵢₐ. A decision x has an excess cost
E(x) = Σᵢ Σₐ σᵢₐ·(xₐ − θᵢₐ)² − Σᵢ Σₐ σᵢₐ·(x*ₐ − θᵢₐ)²,
summed over members and axes, which is 0 at x* and largest, E_max, at the worst feasible decision. The welfare score is W = 1 − 2·E(x)/E_max, so the optimum scores +1 and the worst feasible decision −1. The share of attainable welfare lost is (1 − W)/2, and the added loss from a bloc is that share with the bloc minus the same share in the same realm without it. Gains between two rules are differences in W. The score makes no claim that anyone is right to want what they want, a question we assume is computationally and philosophically unanswerable. Every experiment below says in one line what it decides, among whom, and against which rule.
Heat, a design hypothesis. The welfare score needs every member’s ideals, which only a simulation can see; a real realm needs a signal it can observe. Every vote beyond the first costs Ᵽ, so members spend it only where they care enough to push. We therefore expect a realm’s heat, the Ᵽ spent beyond free votes per unit of time, to rise with dissatisfaction, fall as the realm serves its members well, and point to the decisions causing it. Like Net Promoter Score, it would track how people feel; unlike a survey, it is continuous, costly to send, and points at what to fix. Whether heat tracks welfare is a hypothesis we will measure in live realms.
4.6 Blocs and defection
Trials on membership use a contiguous bloc, the members nearest one extreme of interest space, with a scattered bloc as a control; trials on decisions use the best-connected members, all voting +0.9 on every issue, with a bloc formed around shared aims as a control.
Blocs leak. “A conspiracy around what?” Collusion gets harder with size [50–52]: “four are few and six are many” [51]. A bloc member defects on an issue with probability (1 − monitoring) · [1 − exp(−λ·(B − 1)·(d/6) − μ·salience·|line − own aim|)], rising with bloc size B (rate λ), the number of issues d, and the line’s distance from their own aims (rate μ). A secret ballot makes vote-buying unenforceable [53], as Chile’s 1958 reform showed [54]. In ⱣOWERŦIME no one can see anyone else’s votes, so a bloc cannot monitor its members and monitoring is 0. In a hierarchy, votes can be traced to the voter, so we sweep monitoring there from 0 to 1, default 0.9. Defection is on by default, at a deliberately low λ = 0.01 (assumed; no measured rate exists), swept 0.01–0.03.
Interests pull blocs apart. A bloc’s line is one position that every member must vote for, so the more issues a realm decides, the more often each member must vote against their own aims, and no one can check that they did. A small, tight group can manage it; a bloc large enough to matter cannot.
4.7 Design properties
By design. Two ⱣOWERŦIME results follow from how the system is built rather than from a measured behaviour, and we label them “by design” wherever they appear. Work in a realm can be traced to whoever did it, so ⱣOWERŦIME pays no pooling loss (§6.1); and every member holds a binding say over their own work and the decisions that affect them, so every member engages wherever they judge it worthwhile (§6.6). We tested both. With a 10% pooling loss, ⱣOWERŦIME still keeps 2.3–3.2 times a hierarchy’s output per head at 150 people; with only 90% of members engaged, 2.5–3.5 times; and with 80% engaged, 2.4–3.4 times.
5. No tyranny: of the minority or of the majority
5.1 Pay: the people who pay are the people who judge
Can a minority pay itself more?
Compensation Review. So that pay follows contribution and no one can vote themselves a raise, every change to a member’s Ŧake goes through a Compensation Review. Any member can propose a new Ŧake for any member, themselves included. A panel is then drawn outward from that member, ring by ring through the people with ties into them, and topped up by island hops from elsewhere in the realm (§4.4); the proposer is never seated. Because the panel grows from the ties other people hold into the member, the member cannot choose their judges, and the panel mixes near rings, who know the work, with far ones, who have no stake in the friendship. Panelists vote to approve or reject, the first vote free and each further vote costing twice the one before (§4.5). Once a quorum of distinct panelists has voted, the change passes if approvals outnumber rejections, and a tie keeps the current Ŧake. Ŧakes always sum to 100%, so every other member funds a raise pro rata, and no one can choose who pays for it.
The panel is drawn from the subject’s rings: the people who see the work, and whose own Ŧake a raise would dilute. We test a coalition that files Compensation Reviews one after another to raise its own members’ Ŧakes, with full loyalty and foresight.
A minority coalition lands no raises. A coalition of a third of 9 members lands none of 60 attempted raises, and 7 of 20 members land none of 140 (20 runs each). A two-thirds majority can raise its own pay (all of its raises at 9 members, 63% at 20), which is majority rule, and it pays for it out of everyone’s Ŧake, its own members’ included, since every raise dilutes every other member.
5.2 Firing: a bloc cannot expel the people who matter
Can a bloc, even a large majority, fire its way to control? That is tyranny of the majority at its bluntest.
Expulsion. To let a realm remove someone who costs more than they add, without giving anyone the power to fire, a member leaves against their will only through an expulsion review. Any member can file one, but the panel is drawn from the target’s rings, never the filer’s, and is decided like a Compensation Review (§5.1). If it passes, the member leaves and their Ŧake returns to everyone else pro rata, while their contribution leaves with them, so each panelist weighs the work the realm would lose against the pay it would get back (§4.3). When a minority wins a review, the Ᵽ ratio between it and the majority is preserved, so a majority cannot wear the minority down by filing the same expulsion again and again (§4.5).
Valuable members are defended by people who never worked with them. A panel judges a member by their perceived value, passed along from person to person by those who did, so in the model a member’s true value correlates −0.92 with the panel’s willingness to expel them at N = 150 (5 seeds; −0.85 and −0.86 with productivity correlated +0.5 and −0.5 with connectedness).
A bloc cannot expel the people who matter. A bloc of 10% to 90% of members files expulsions in a healthy realm, each time against whoever outside it would most raise its own members’ well-being: their income, their work, the work of covering for the expelled, and how close decisions land to their aims. Panels block it where it counts: 23% of the members it targets are net producers, but only 10% of those it actually expels are, against 37% of the realm. What gets through is mostly trimming, members who cost more than they add, so pay rises for everyone and output stays at 97% or more.
What a campaign does achieve is small. At N = 150 the bloc gains at most 0.8% of its members’ total stakes and everyone else loses at most 2.4% (medians of 20 seeds; Figure 2). The remnant pays in covering expelled colleagues’ work and in decisions pulled toward the bloc’s aims (Figure 3). 5 of 180 runs cost the remnant 5% or more, all with blocs of 70% to 90%.
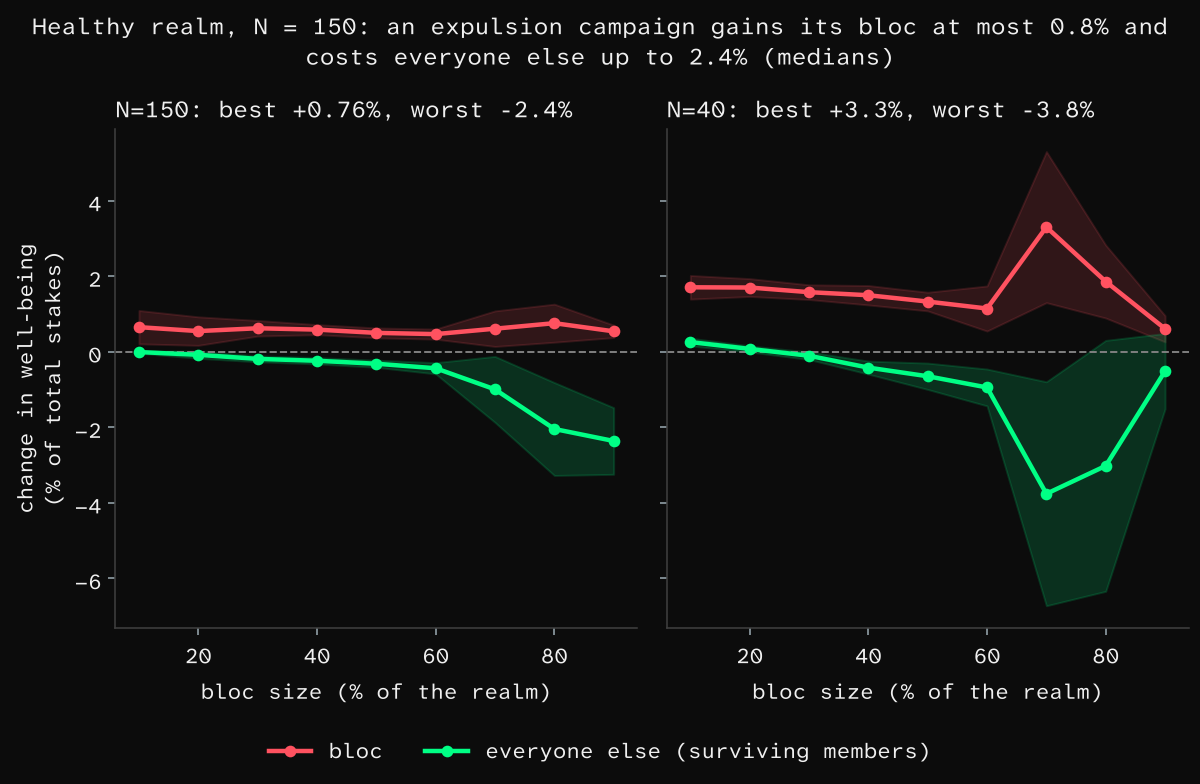
Figure 2. What an expulsion campaign gains its bloc (red) and costs the remnant (green, everyone else: the surviving members outside the bloc), as a share of each member’s total stakes, by bloc size, in a healthy realm at N = 150 (left) and N = 40 (right). Lines: median of 20 seeds; bands: median ± half the interquartile range across seeds. The bloc picks targets by its own members’ well-being, and decisions are local.
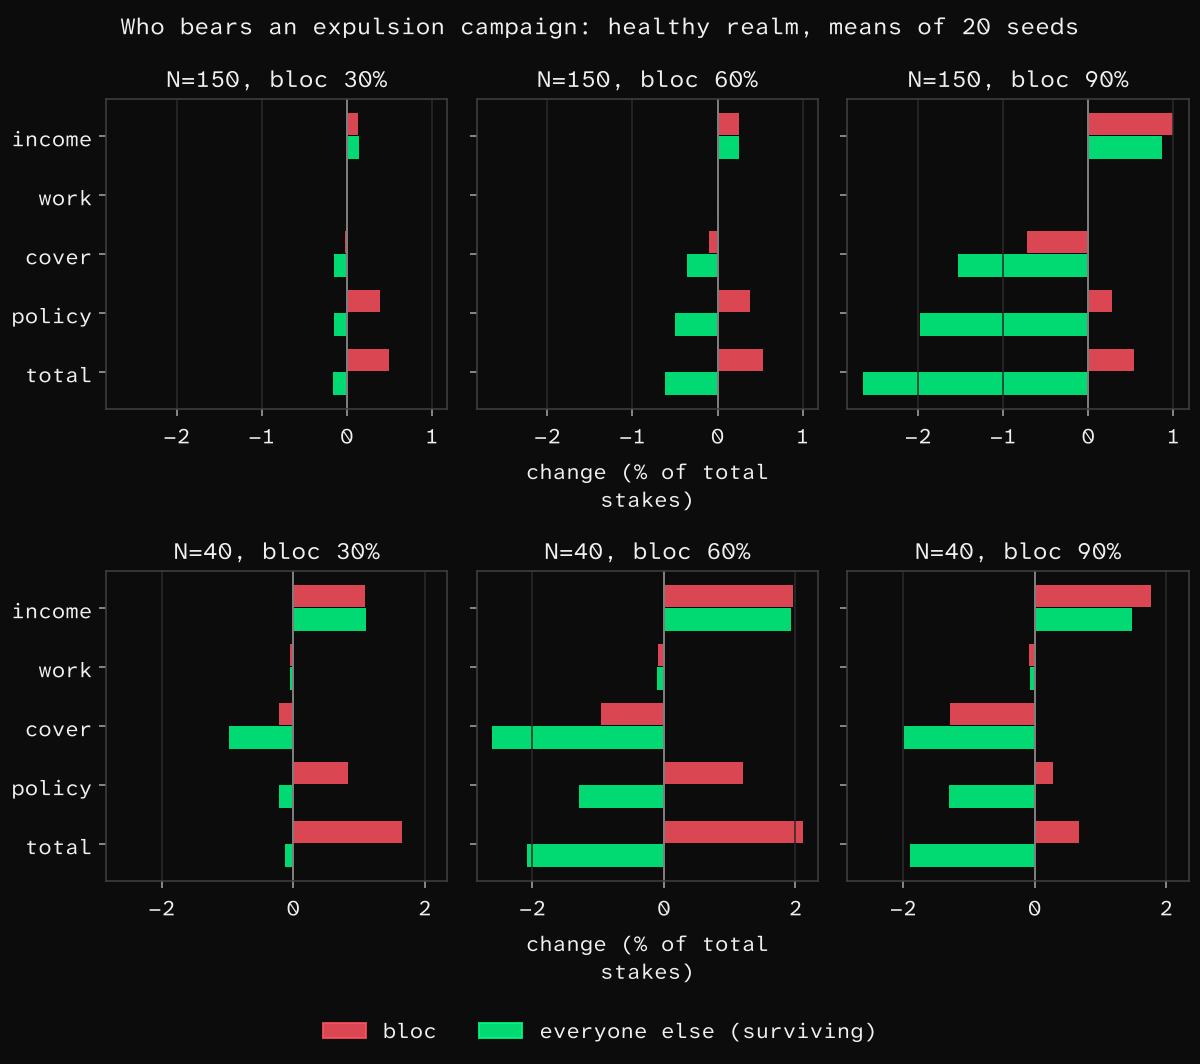
Figure 3. Who bears an expulsion campaign, by part of well-being, for blocs of 30%, 60% and 90% at N = 150 (top) and N = 40 (bottom): income (Ŧake returned net of output lost), own work, covering the expelled members’ work, and policy. Bars: means of 20 seeds, as a share of each member’s total stakes; bloc in red, everyone else in green.
Campaigns have no motive. With each member’s own income weighted 0.1 to 100 times their other interests, and panelists with under 1% of their stakes at issue abstaining, a campaign (three or more expulsions) succeeded in 2 of 1,080 runs, both by a 90% bloc. With every seated panelist voting, campaigns succeed only from a 70–80% bloc. In a realm carrying dead wood, expulsions succeed from a 10% bloc, which is the realm trimming dead wood as intended (Figure 4).
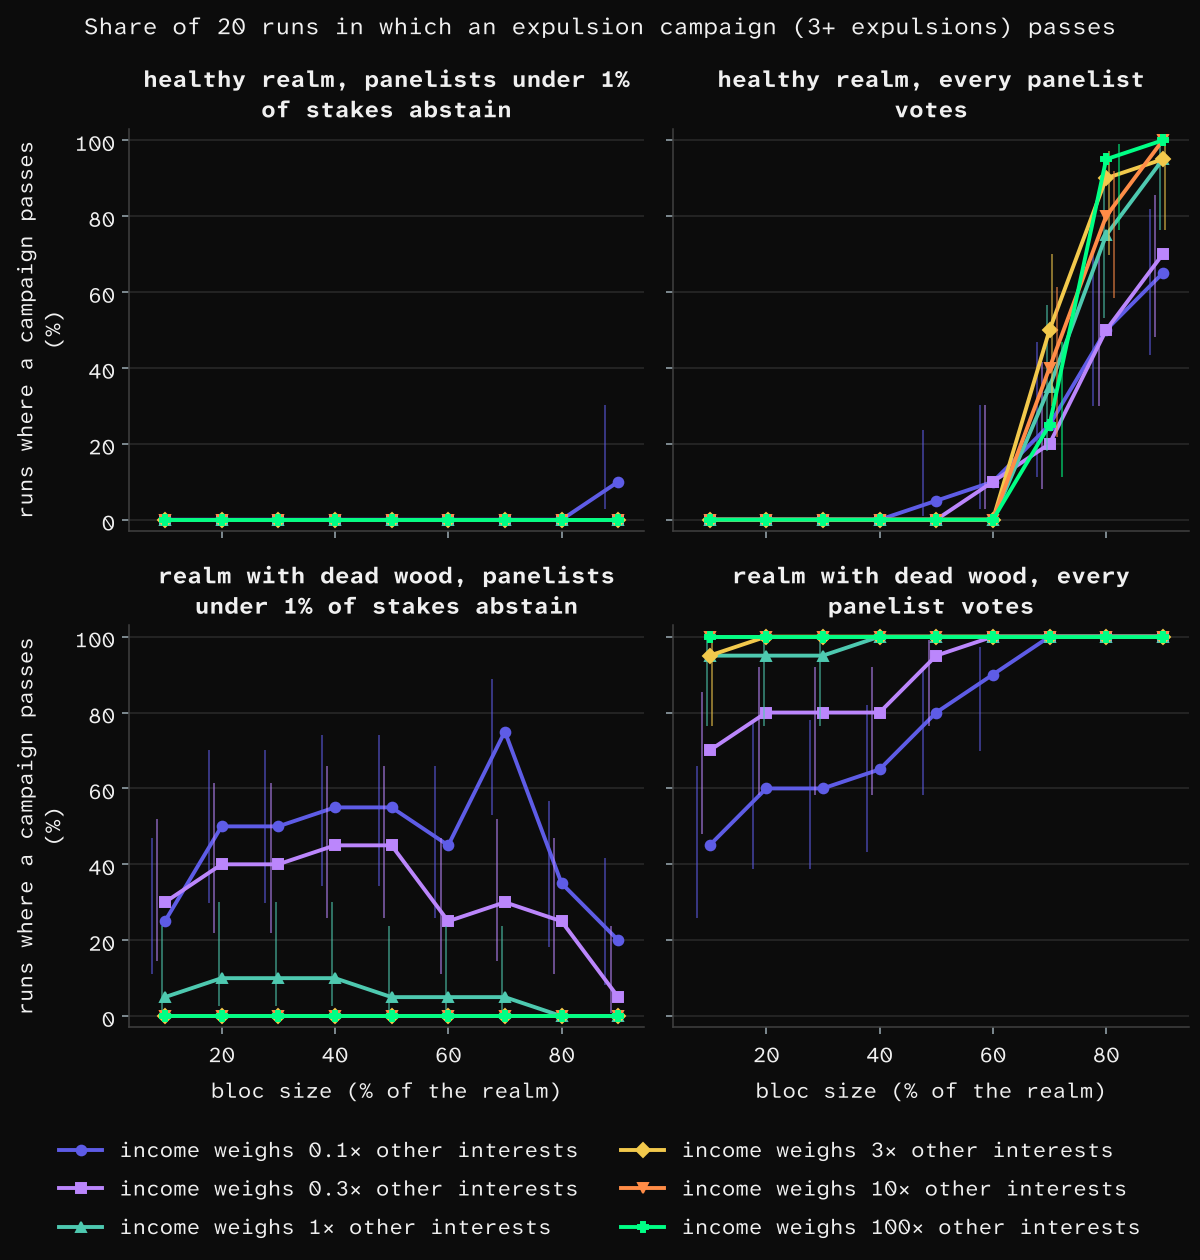
Figure 4. Share of 20 runs in which an expulsion campaign (three or more expulsions) passes, by bloc size, for income weights from 0.1 to 100 times a member’s other interests (N = 150). Top: a healthy realm; bottom: a realm carrying dead wood. Left: panelists with under 1% of their stakes at issue abstain; right: every seated panelist votes. Bars: 95% interval on the share.
5.3 Hiring: fakes do not get in
Can a minority hire its way to control by packing the realm with sybils: fake accounts, or loyalists who produce nothing?
Induction. So that a realm grows only by people worth more than they cost, every new member enters through an induction review. An existing member nominates them at a stated Ŧake, and the nomination is recorded against the nominator, so a nominator who keeps proposing people who add nothing builds a record that panelists can see. A nominee has no ties in the realm yet, so the panel is drawn from the nominator’s rings instead, with the nominator excluded from it, and is decided like a Compensation Review (§5.1). Every admission dilutes every member’s Ŧake and political weight, so each panelist has a standing, personal reason to turn fakes away, and the realm needs no identity check to do it.
Hiring is priced. A nominee with productivity p admitted at Ŧake share t pays off for existing members exactly when t < t* = 1 − O/p² (§4.3), so a sybil, which produces nothing, pays off at no Ŧake at all. Panelists estimate the nominee’s productivity with noise (8% in ring 1, more in each ring further out), factor in the proposer’s recorded track record, and weigh three costs: diluted Ŧake, diluted political weight and the harm of admitting someone below the bar.
Starting with no fakes inside, bribery alone buys nothing. A briber who pays members only to nominate fakes gets no fake admitted in any of 300 runs (95% upper bound 1.2% of runs), across 5–20% of members corruptible, a price of 1 or 3 periods of pay, and a budget of 10 or 100; up to 29 paid nominations per run were all rejected. When bribed members also vote the line, a few fakes get in (1.2% of members at peak on average), at 37 periods of pay each, and members expel most of them. In detail, at the most generous setting fakes get in during 14 of 20 runs, 1.9 per run on average, peaking at 1.2% of members (interquartile range 0–1.3%, largest 5.9%) and down to 0.43% after 36 periods (Figure 5).
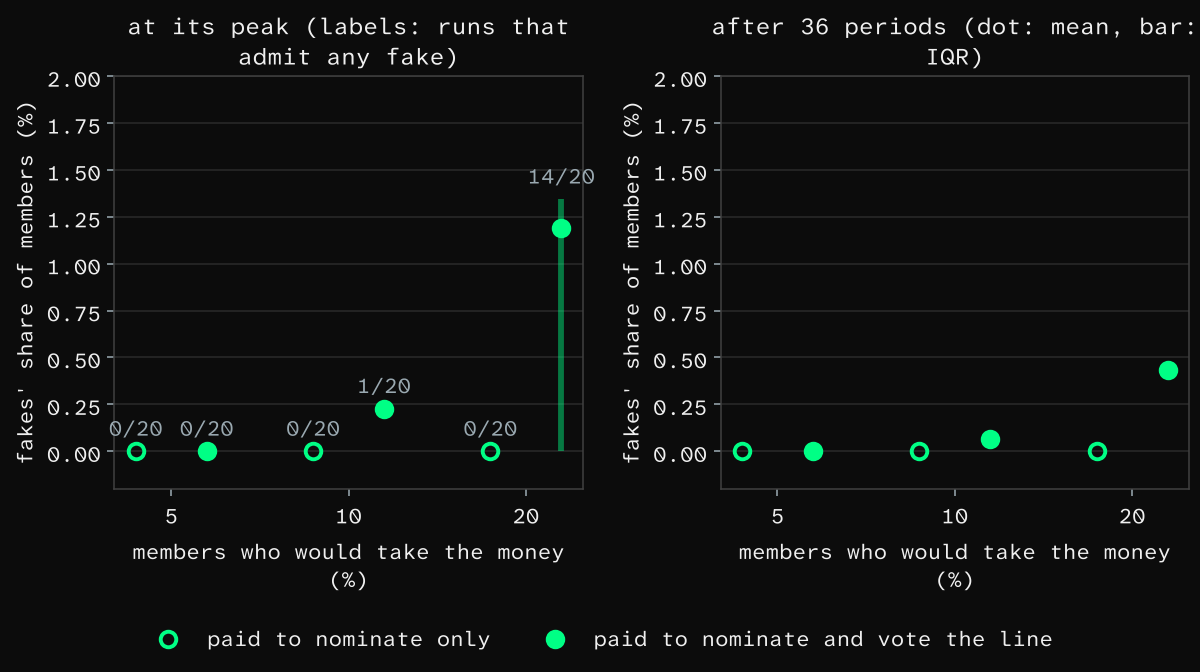
Figure 5. Fake accounts admitted when a briber pays members to nominate fakes (open circles) or to nominate and vote the line (filled), by the share of members who would take the money; N = 150, panels drawn from the nominator’s rings, 36 periods. Left: fakes’ share of members at its peak, labelled with the runs (of 20) that admit any fake; right: share after 36 periods. Dots: mean of 20 seeds; bars: interquartile range.
5.4 Extraction: the many cannot live off the few
Can a majority live off the productive few?
Ŧake, paid in Ŧ, and the right to leave. To keep the many from living off the few, ⱣOWERŦIME ties every member’s pay to the realm’s output and lets anyone leave at any time. Ŧake is a partition: Ŧakes sum to 100%, so one member’s cut is everyone else’s raise, and every cut must pass a Compensation Review on the cut member’s own panel (§5.1). Ŧake is paid in Ŧ, the unit the realm prices its output in, so a cut that makes the few work less shrinks the output every member’s share is drawn from (§4.3). Leaving needs no one’s approval: a leaver’s Ŧake returns to the rest pro rata, and what they would have produced leaves with them.
Returns to effort, pay cuts and exit defend the few; pay levels do not. Raising pay levels barely moves effort [55–57]; doubling Indonesian teachers’ pay had a precisely estimated effect of zero [58]. Returns to effort, however, do move it: piece rates raised output 44%, half by selection [59], and 20% for tree planters [60]; a crop share raised from 50% to 75% raised output 60% [61], most where effort is unsupervised [62, 63], as in a realm. Pay cuts, meanwhile, destroy effort [64], by over 20% with no fade-out [65], and unjustified inequality alone cuts output [66]. And people leave: quit elasticities run around 2 [67], meaning 1% less pay raises the quit rate about 2%, and top talent follows net pay [68–70]. Where exit was legally blocked, lifting the block raised pay [71–73]; markdowns persist even without lock-in [74], so exit bounds extraction rather than ending it. Company towns with open labour markets did not extract [75]; historical regimes of sustained extraction relied on blocking exit [76], and noncompete agreements still limit it today [77]. A realm cannot block exit.
Through real reviews, adoption ends grabs. We then run grabs through Compensation Reviews under ⱣOWERŦIME’s rules (§4.3–§4.5), with members who quit when an outside option beats a cut, and coalitions that form from a sweep of motives, including dislike of unequal pay (inequity aversion) [78]. Each grab proposes cutting its victim’s Ŧake to 0.6 times fair value. A grab is a cut below fair value, whereas consensus cuts of real underperformers are corrections. With grievance off, grabs pass 35%, 19% and 9% of the time where skills are balanced, as the share of the economy organized as realms rises from none to half to all of it; 12%, 4% and 3% where skills are scarce; and 68%, 46% and 13% where they are easy to replace. Victims lose 28% of fair value where skills are easy to replace, 33% where balanced and 37% where scarce. Counted across all members, as a hierarchy’s markdown is, grabs take 13% of pay below fair value where skills are balanced, 5.7% where scarce and 19% where easy to replace, against the markdown of about 20% that hierarchies impose on everyone [67] (16% and 24% are our adjustments for the scarce and easy-to-replace mixes). Adoption shrinks the grabs to 7.1%, 1.5% and 17% when half the economy runs as realms, and to 2.4%, 0.7% and 4.9% when all of it does. What a grab pays its supporters falls from +16% to +7% to +2% where skills are balanced, and from +65% to +29% to +7% where they are easy to replace, relative to their pay before the grab. Letting grievance cut effort lowers what a grab pays by up to 7 percentage points and moves the other figures by 2 points or less (Figure 6).
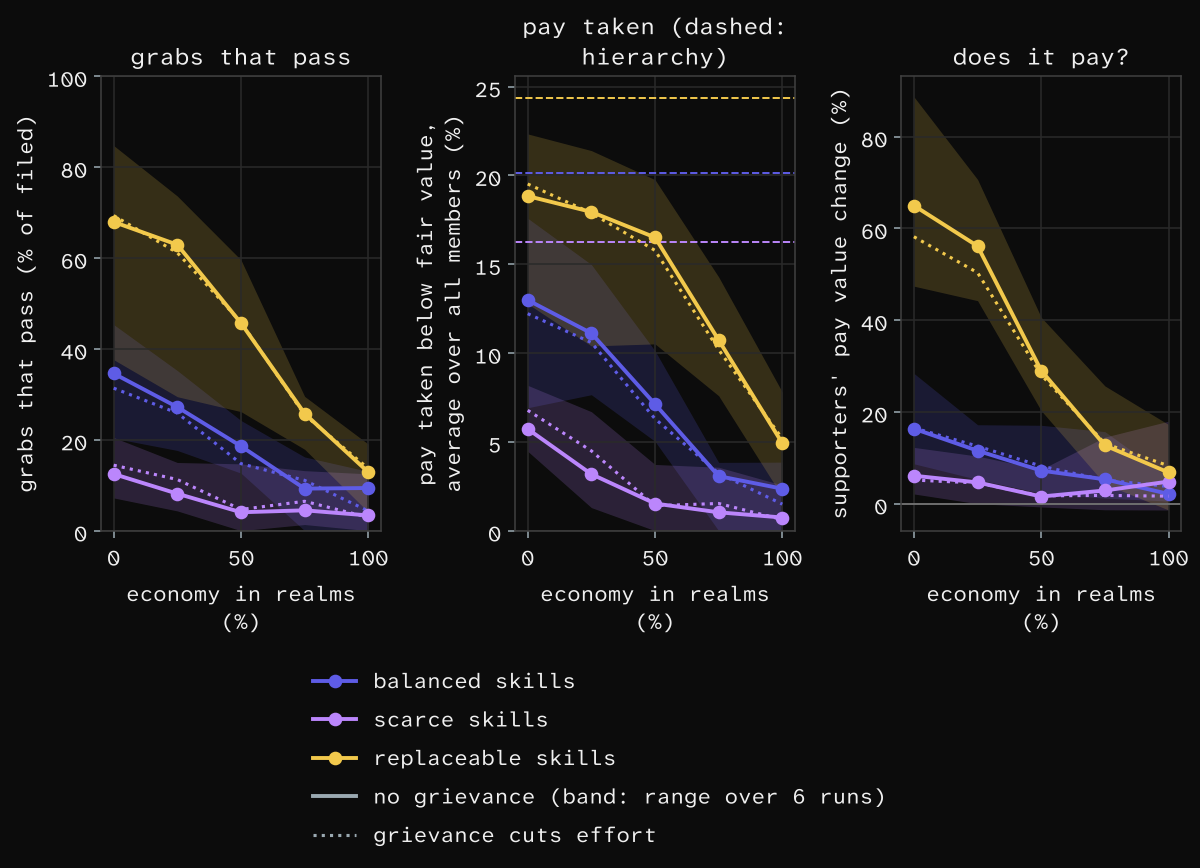
Figure 6. Grabs run through Compensation Reviews (N = 60) as the share of the economy organized as realms rises from 0 to 100%, by skill mix (balanced, scarce, easy to replace): share of filed grabs that pass (left), pay taken below fair value averaged over all members (centre; dashed: the hierarchy’s markdown for the same mix), and the change in supporters’ pay value (right). Each grab proposes 0.6 times the victim’s fair value. Solid lines: mean of 6 runs with grievance off; dotted: grievance cuts effort; bands: range over the 6 runs.
5.5 Decisions: no bloc decides for everyone
Can a bloc decide for everyone?
The write-in poll and the Ᵽ auction. So that a decision lands where the members it affects want it, and not where an organized bloc wants it, ⱣOWERŦIME decides with a write-in poll among those members. Any member can start one, and no chair sets the agenda. A member’s first vote is free and may create a new option; each further vote costs twice the one before, paid in Ᵽ, a voting budget that is the same for every member, cannot be bought or transferred, and serves every question, so pushing hard on one question leaves less for the rest (§4.5). The option with the most votes wins, and members carry out the result. The tally is live but anonymous: everyone sees where the options stand, no one sees who voted for what, and a member can move their votes to another option at no cost until the close. The close comes at a random moment that no one knows in advance (a candle close), so no one can time a last-minute swing. Honest members can therefore find a common option and move to it, while a bloc can never check that its members voted the line.
Setup. Members decide six issue axes in write-in polls; we compare ⱣOWERŦIME’s write-in poll with concentrated weight (h = 4) with the bloc in the most heavily weighted seats (N = 150, 24 seeds on each of two interest layouts, 48 realms). An axis is captured when the bloc’s option wins and the same people voting their own ideals would not have chosen anything near it; a realm’s capture threshold is the smallest bloc capturing more than half the axes. Scores are §4.5’s welfare score.
Under concentrated weight, a bloc of 5% or less captures decisions, and a 34% bloc drives the welfare score to −0.37. ⱣOWERŦIME, by contrast, holds. When honest voters coordinate, a bloc of up to a third never captured a poll (0 of 336 runs, seven bloc sizes up to 34% in each of 48 realms; 95% upper bound 1.1%), and larger blocs rarely did: 4 of 48 realms, by blocs of 38–50%. A 34% bloc leaves the welfare score at 0.82. The threshold stays above 50% until about half of honest voters fail to coordinate and stay with their first choice; only as that share rises from 0.6 to 1.0 does it fall, through 36%, 31%, 23%, 18% and 13% (Figure 7).
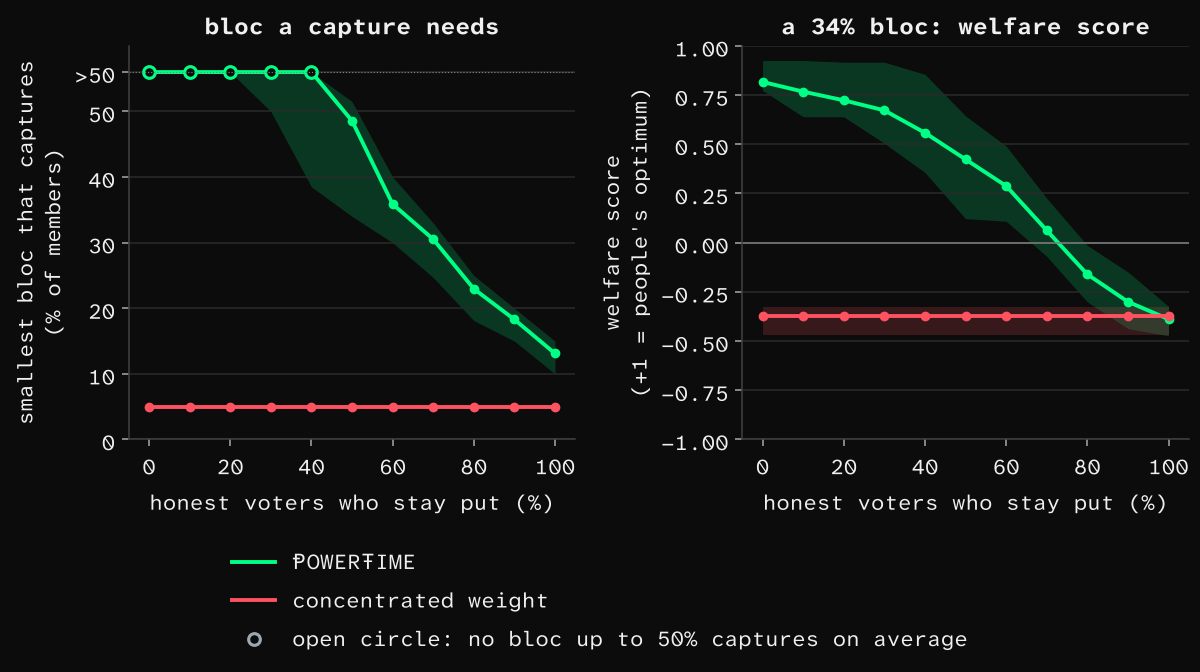
Figure 7. Write-in polls at N = 150, ⱣOWERŦIME (green) against concentrated weight (red), by the share of honest voters who stay with their first choice. Left: the smallest bloc that captures more than half the axes; a realm where no bloc up to 50% captures is plotted at >50 (open circles). Right: a 34% bloc’s welfare score (+1 = the members’ own optimum). Lines: seed mean (24 realms per layout); bands: interquartile range across realms. Defection on (λ = 0.01).
Under realistic turnout, a bloc takes little. Now members vote with turnout driven by how much they care (§4.5), write-in options merge when they are close enough, and the Ᵽ auction runs over 12 issues. We sweep the bloc from 5% to 50% of members and the turnout multiplier from 1 to 0.25 (32 seeds). A bloc of any size from 5% to 50% costs ⱣOWERŦIME at most 2.7% of the attainable welfare at the usual turnout, 2.6% at three-quarters, 5.3% at half and 11% at a quarter. Free votes alone, the direct-democracy baseline, lose up to 6.4%, 7.2%, 12.5% and 31%, and concentrated weight loses 64–68% at every bloc size and turnout (Figure 8). The middle half of seeds stays below 4%, 5.4%, 10% and 16% for ⱣOWERŦIME at the four turnouts. Most sensitive to: honest turnout (a multiplier from 1 down to 0.25 moves ⱣOWERŦIME’s largest added loss from 2.7% to 11%).
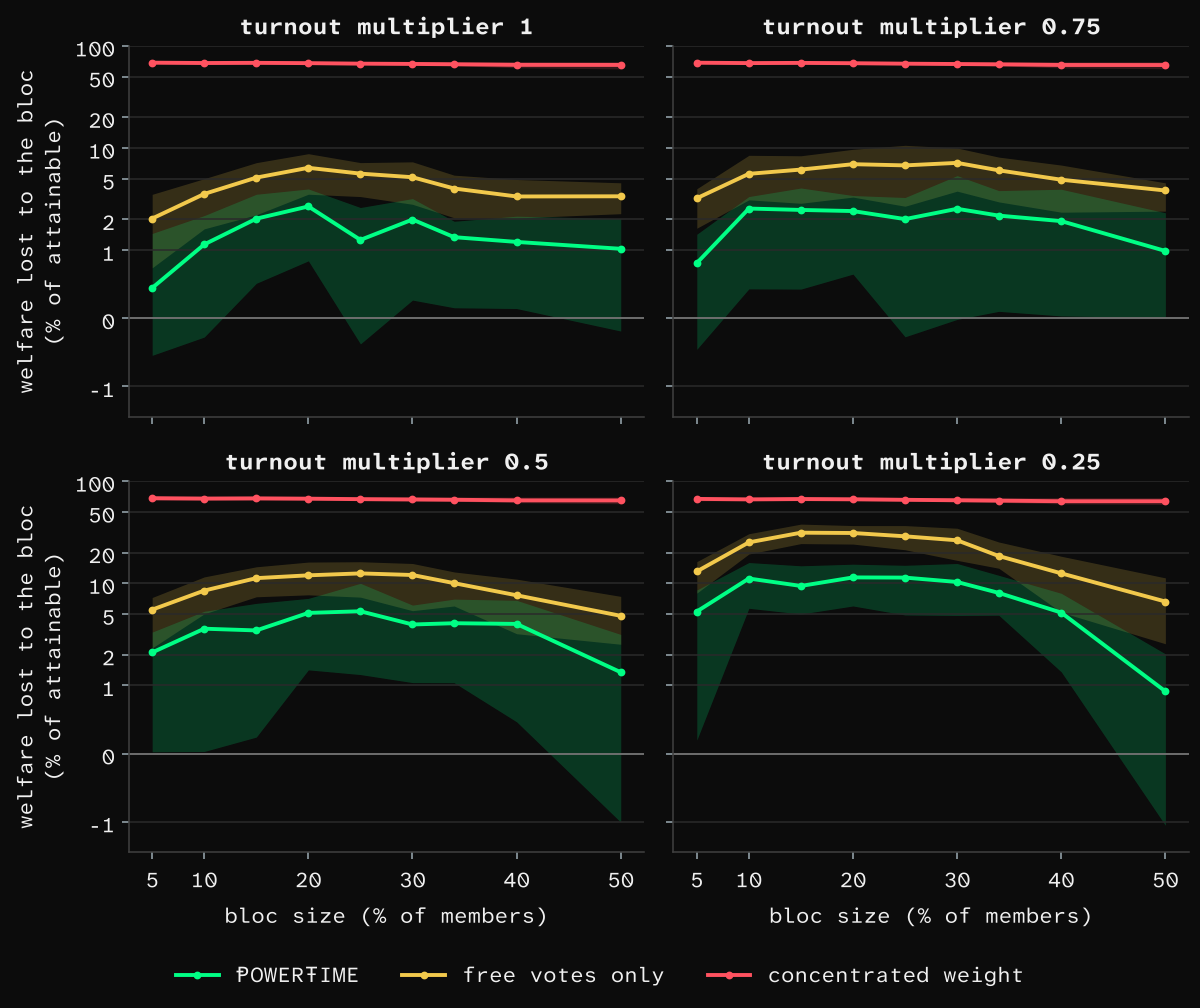
Figure 8. Welfare lost to a bloc, as a share of the attainable welfare (added loss, §4.5), by bloc size from 5% to 50% of members, for ⱣOWERŦIME, the same poll with free votes only, and concentrated weight (h = 4, votes traceable, monitoring 0.9), at turnout multipliers 1, 0.75, 0.5 and 0.25. N = 150, 12 issues; lines: mean of 32 seeds; bands: interquartile range across seeds. Defection on (λ = 0.01).
Blocs cannot police their members. A bloc must stay organized across issues, and under default defection (λ = 0.01) the largest bloc that does is 40% (15% at λ = 0.03; none at μ = 5). Because no one can see anyone else’s votes, ⱣOWERŦIME polls are captured in only 1–2% of runs at any defection setting when honest voters coordinate (17 and 12 of 1,296), whereas concentrated weight with traceable votes falls to a bloc of 5% or less in every setting.
6. Productivity: alignment, coordination and cooperation as output
6.1 Loafing and entry screening
Do people give their full effort when work is shared?
Review on demand. To keep each member’s pay tied to their own effort, ⱣOWERŦIME sets Ŧake by Compensation Review (§5.1) and lets any member call one, or an expulsion (§5.2), on any member at any time. The colleagues who carry a coaster’s work sit in the coaster’s first ring, where every panel starts, so the people who notice first are the ones who judge, and they gain when a coaster’s Ŧake returns to everyone pro rata.
Pooling costs effort. When n people pool their work, effort per head falls as n^−0.14 [79], and rope pullers in groups of eight pulled at 49% of solo strength [80]. The effect holds across 78 studies [81] and in pseudo-groups that isolate motivation [82], driven by not being identifiable [83], feeling dispensable [84], not wanting to carry slackers (the sucker effect) [85] and incentives diluted as 1/n [43].
On both sides, whoever admits and reviews acts on their own payoff, using ratings from what they observe (§6.2). A ⱣOWERŦIME newcomer dilutes members’ Ŧake and political weight (ω, swept 0 to 0.1, central 0.025), and review sets their Ŧake in proportion to contribution, so panelists admit anyone expected to add at least their pay. A hierarchy’s hire is paid by the company and enlarges the manager’s team, so the manager’s bar sits below average [86, 87]. ⱣOWERŦIME has no scheduled reviews: a coaster’s collaborators call a review when the work they carry for them, plus the coaster’s Ŧake that would return to everyone pro rata, outweighs friendship and the effort of calling it, whereas a manager reviews on schedule and acts if their share of the gain outweighs the headcount they would lose.
ⱣOWERŦIME has no pooling loss, by design. Because work in a realm can be traced to whoever did it, the only loss is the delay before a review catches a coaster, so ⱣOWERŦIME keeps 0.95–1.00 of solo output per head at any size, against a pooled department’s 0.91–0.93 at two people and 0.72–0.77 at twelve (Figure 9). §4.7 tests the design with a 10% pooling loss. Most sensitive to: pool size for the hierarchy (two to twelve people moves it from 0.91–0.93 to 0.72–0.77) and review friction for ⱣOWERŦIME (low- to high-friction moves it from 1.00 to 0.95).
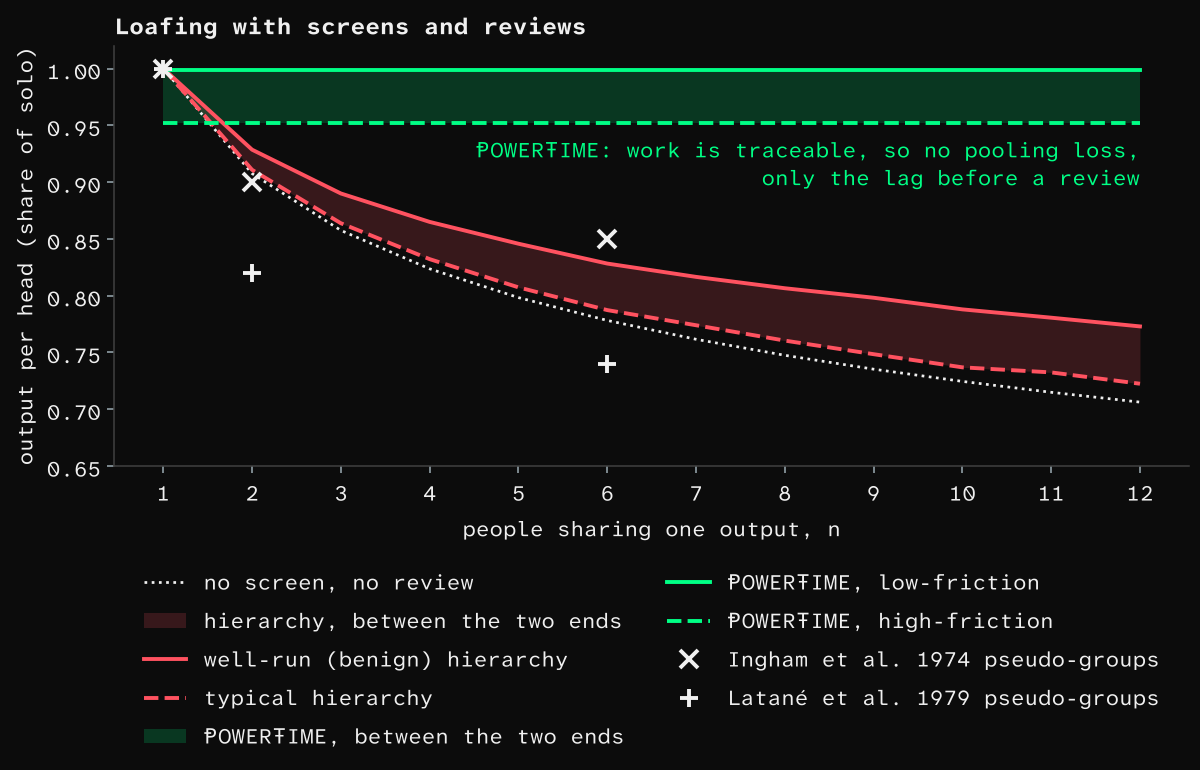
Figure 9. Output per head, as a share of working alone, by the number of people sharing one output: a pooled hierarchy department between its well-run and typical ends (red band) against ⱣOWERŦIME between its low- and high-friction ends (green band; flat by design, since work is traceable). Dotted: no screening and no review. Crosses: measured pseudo-group results [79, 82]. ⱣOWERŦIME: mean of 24 seeds; hierarchy: mean of 6.
6.2 Who knows your work?
Can a manager judge their people?
Panels pool the people who see the work. To judge a member by what they actually do, ⱣOWERŦIME asks the many people who see it rather than one rater. A review’s panel draws first on the people with ties into the member, then on their contacts (§5.1), and each panelist’s vote is one observation that the tally pools. The member is never on their own panel, so self-assessment, which agrees only modestly with others’ ratings [41], never enters the count. Only ties that are or were mutual count, and a member cannot drop the people who hear them, so no one can choose their own raters.
Hierarchies route judgment about each person through one rater, yet in the largest decomposition of multi-rater data, covering more than 4,400 managers, the rater’s own idiosyncrasies explained 53–62% of the variance in ratings, and the ratee’s actual performance 21–25% [88]: a rating says more about the person giving it than the person receiving it. Even expert reviewers scoring the same grant applications barely agree [101].
Peers win on numbers. Per rater, a supervisor is slightly more reliable than a peer, .50–.52 against .37 [16, 89], but a person has one manager and many colleagues: in a field study of police squads, a single pair of squad-mates’ rankings agreed at .62 and the squad’s pooled rankings at .94 [90]. Peers rate what supervisors rate: corrected for measurement error, the two correlate at .62 [40], and for overall performance they converge completely [91]. Agreement grows with the time a rater has to observe [92], and pooled peer judgment predicts later performance and promotion at validities around .40–.49 [93–96].
A single rater also has reasons to skew ratings. Ratings used for pay run a third of a standard deviation more lenient than the same ratings collected for research [97]; executives describe inflating and deflating ratings for political ends [98]; and raters compress the tails, marking stars down and weak performers up [99].
In the model, ratings come from what each rater observes. A working partner sees most of a colleague’s work and rates at an assumed reliability of .64, and three partners pooled reach .84, while a manager’s view thins with span: .64, .52, .40 and .31 at spans of 3, 5, 8 and 12. The advantage therefore follows from these assumed reliabilities, by design. Asked to place a member in the right tenth (decile) of true contribution, three pooled partners are right 0.74 of the time at the top, 0.16 in the middle and 0.34 at the bottom; one manager with five reports 0.46, 0.13 and 0.23; one with twelve 0.39, 0.08 and 0.14 (Figure 10). Peers are best at exactly the ends that reviews act on. Ranking and naming the strongest and weakest produce far more agreement than scores [90, 100], though no workplace study has yet measured agreement at the tails directly.
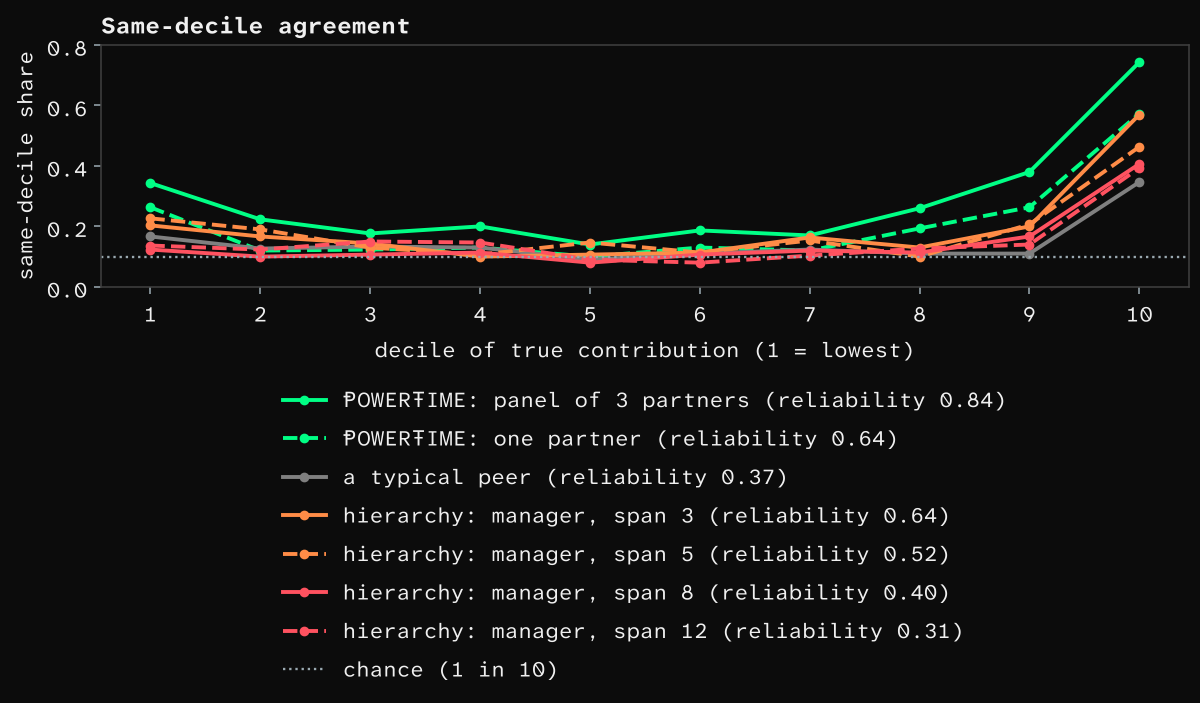
Figure 10. How often a rater places a member in the right tenth of true contribution, by decile (1 = lowest), for a ⱣOWERŦIME panel of three working partners, one partner, a typical peer, and a manager with 3, 5, 8 or 12 reports (reliabilities in the legend, assumed from observation). N = 150, 20 seeds. Dotted line: chance, two raters placing a member at random agree on a decile 1 time in 10.
6.3 Partners and friction
Can people work with those they agree with?
Chosen ties. So that people work with those they work well with, ⱣOWERŦIME lets every member choose whom they connect to, and so whom they work with. Each member hears up to 150 people of their own choosing (§4.1), and no one is assigned a boss or a team. Work that nobody would choose still gets done, because a member who takes it on can ask for a higher Ŧake for it through Compensation Review (§5.1).
Disagreement costs energy, and the cost rises faster than the disagreement: a pair with disagreement Δ pays min(1, (Δ/0.7)^γ), scaled by a friction strength. In a hierarchy, working pairs are its reporting lines, whereas ⱣOWERŦIME members choose their own partners.
ⱣOWERŦIME beats even a well-run hierarchy. Chosen partners’ aims correlate at 0.48–0.51, against 0.27 along a well-run reporting tree and 0.14 under typical hiring, so at γ = 2 chosen pairs keep 0.83 of capacity, against 0.66 for a well-run hierarchy and 0.58 for a typical one. Most sensitive to: γ (1 to 3 moves ⱣOWERŦIME from 0.64 to 0.91, a well-run hierarchy from 0.47 to 0.75 and a typical one from 0.40 to 0.67).
People choose partners by their own payoff. Some disagreement brings diversity worth having, so each member picks the pairs that pay them best. With a diversity benefit of 0.15, ⱣOWERŦIME realizes 1.02 of capacity against 0.82 for a well-run hierarchy that allows informal choice within teams (interquartile range 0.81–0.84) and 0.74 for a typical one (Figure 11). Chosen pairs disagree by Δ = 0.20 on average, against 0.35 and 0.41. Most sensitive to: the diversity benefit (0 to 0.3 moves ⱣOWERŦIME from 0.92 to 1.09–1.17, a well-run hierarchy from 0.69 to 0.94–0.95 and a typical one from 0.61 to 0.85–0.88). Unwanted work still gets done: with no extra pay for it ⱣOWERŦIME covers 81% of tasks (output 0.82 against the hierarchy’s 0.83), and a Ŧake premium for unpleasant work of 0.5, 1 or 1.5 covers 92%, 97% or 100% (output 0.92, 0.94, 0.95).
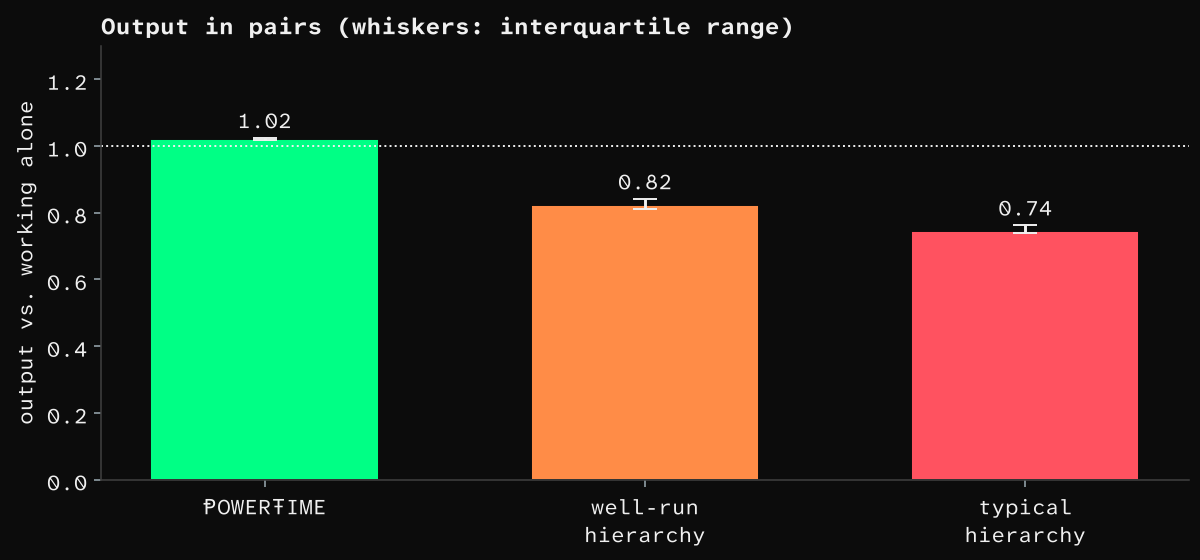
Figure 11. Output in working pairs as a share of working alone, when members choose partners by their own payoff: ⱣOWERŦIME, a well-run hierarchy with informal choice within teams, and a typical hierarchy. Bars: mean of 20 seeds (N = 150, diversity benefit 0.15); whiskers: interquartile range across seeds.
6.4 Information
Do decisions get the information they need?
Local decisions. So that each decision is made where its information already is, ⱣOWERŦIME has no chain of command to pass information up. A matter is decided by a write-in poll among the members it affects (§5.5), and a matter about one member by a panel drawn from the people who work with them (§5.1). A matter for the whole realm, such as changing its level, is a review with the whole realm as its panel, held to the same quorum (§4.4), and if too few vote to reach it, things stay as they are.
In a hierarchy, information loses 40% at each step up the chain [102] and is slanted toward each manager’s boss, although the top also gets direct channels (metrics, surveys, skip-level meetings) carrying 48% (well-run) to 30% (typical) of its information. In ⱣOWERŦIME almost everything is decided locally, by the people it affects; only rare matters go to a review of the whole realm.
Decisions are made where the information is. In a realm of 4,096, ⱣOWERŦIME’s local decisions carry 0.82–0.94 of the available signal at every scope, while a manager deciding for their own team gets 0.79–0.83, falling to 0.11–0.26 at the top, which decides for everyone (Figure 12). A whole-realm review carries 0.39–0.72 when it reaches quorum, which it does 84–100% of the time at normal or high participation in realms of 64 or more; at low participation it stalls and the status quo holds. A review of one member scores 0.96 when six observers who see the work all raise it, and 0.27 when only two do and only 30% of cases are raised, against 0.65 and 0.43 for one manager who acts on 90% or 60% of what they see. Most sensitive to: participation (low to high moves a whole-realm review from 0.39 to 0.72) and, for the hierarchy, its end of the sweep (typical to well-run moves the top from 0.11 to 0.26).
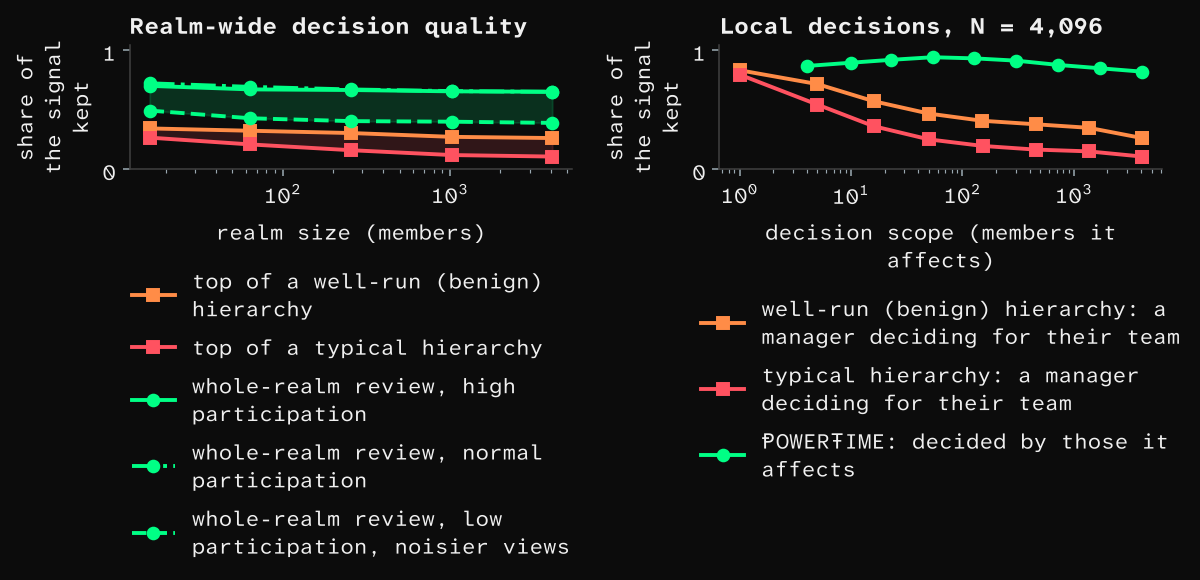
Figure 12. Share of the available signal a decision keeps. Left: decisions for the whole realm, by realm size from 16 to 4,096, the top of a well-run and of a typical hierarchy against a whole-realm review at high, normal and low participation. Right: decisions by scope (members affected) in a realm of 4,096, a manager deciding for their team against ⱣOWERŦIME’s decision by those affected. Means of 3 seeds per size.
6.5 Decisions
Do decisions end up where the people want them?
The Ᵽ auction, weighing how much people care. For a decision to count how much each member cares as well as how many agree, votes beyond the first must cost something real. In the write-in poll (§5.5) they cost Ᵽ at doubling prices, and because one budget serves every question, a member who outspends others on one issue has less for every other, so what each member spends shows what each issue is worth to them. Spent Ᵽ is gone win or lose, so pushing costs the same whether the push succeeds or not (§4.5).
The auction gives those who care most their due. Counting heads cannot tell a mild preference from a deep one, but the Ᵽ auction can. Across 30 issues with one 100 Ᵽ budget per member (N = 150, 16 seeds), we set a minority to care intensely about its issues and the majority mildly. Free votes give the minority under 1% of the issues it should win at every level, while the Ᵽ auction gives it a share that rises with its conviction: 9% at 25% concentration, 29% at 50%, 52% at 75% and 87% at full concentration (Figure 13). Across contested issues the higher-value side wins 24% of the time at 25% concentration (17% under free votes) and 29–87% from half to full concentration, against none under free votes. The share of attainable value realized rises from 0.10 under free votes to 0.91 when intensity is fully concentrated on the minority, a gain of 0.81, and from 0.21 to 0.53 at 50% concentration. When intensity is spread evenly the auction costs nothing (1.00 against 0.99). Each contest burns 355–665 Ᵽ of the realm’s 15,000, the price of revealing intensity. The auction keeps working against a coordinated 34% bloc that defects at the default rate: it still adds 0.52 at full concentration.
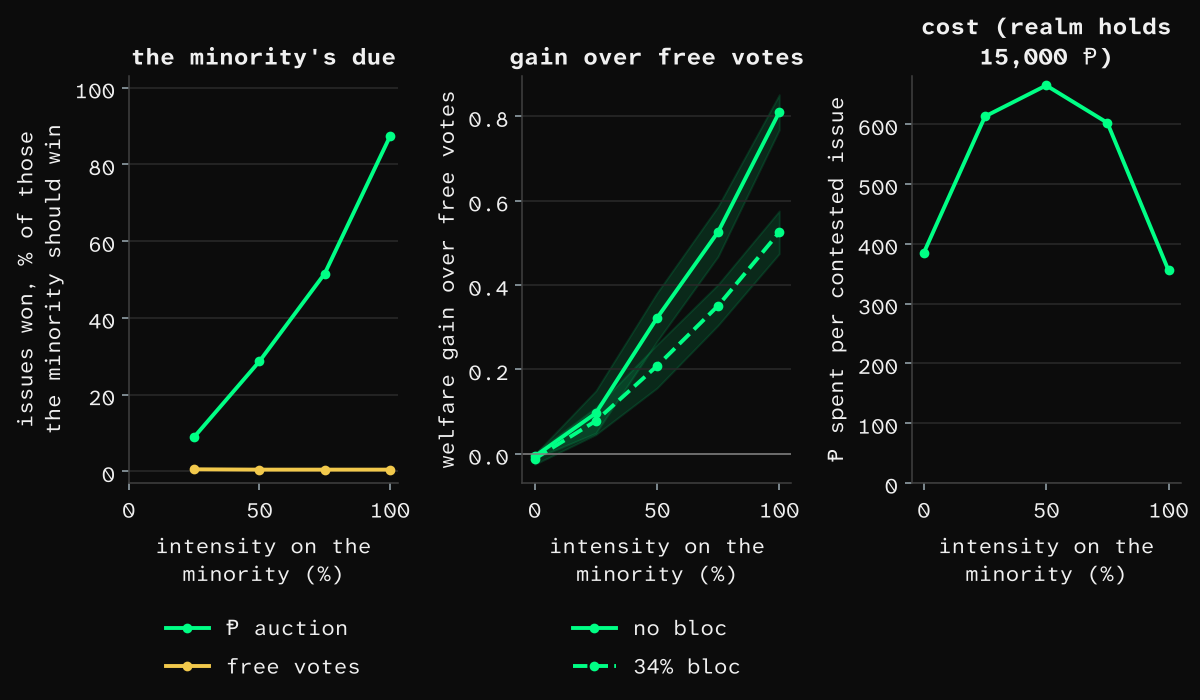
Figure 13. The Ᵽ auction across 30 issues with one 100 Ᵽ budget per member (N = 150), by how much of the intensity sits on the minority. Left: issues the minority wins, as a share of those it should win, under the auction and under free votes. Centre: gain in realized value over free votes, with no bloc and with a 34% bloc. Right: Ᵽ spent per contested issue (the realm holds 15,000). Lines: mean of 16 seeds; bands: 95% bootstrap interval of the mean.
6.6 Voice and engagement
Do people stay engaged?
Binding say. Disengagement starts where people have no say over their own work, so ⱣOWERŦIME gives every member a binding one. Members choose whom they work with (§6.3), vote at equal weight in every poll that affects them (§5.5), and sit on the panels that set pay and membership (§5.1–§5.3), whose results the system carries out without anyone’s sign-off.
100% engagement is a design property. In ⱣOWERŦIME every member holds a binding say over their own work and over the decisions that affect them, so each member engages wherever they think it worthwhile. ⱣOWERŦIME removes voicelessness, one measured driver of disengagement [103]. In the model, binding say is 1.0 for ⱣOWERŦIME against 0.42 for a well-run hierarchy and 0.25 for a typical one, whose staff hold advisory rights at most, and the alignment of decisions with members’ own aims is 0.70 against 0.38 and 0.19.
A hierarchy loses a third or more of its people’s effort. We calibrate both hierarchies to Gallup’s worldwide figures, the largest sample there is: 20% of employees engaged and 16% actively disengaged [1] (in the US, 32% and 18% in 2022 [104]). A well-run and a typical hierarchy then each have about 20% engaged, 64% not engaged and 16% counterproductive (Figure 14). Engagement is calibrated to its modest measured link with performance [105], and engagement predicts task performance beyond job attitudes [106, 107]; fair process (procedural justice) correlates with performance at ρ = .36 [108], on a par with fair outcomes (distributive justice) in the updated analysis [109], and sabotage is a rare, grievance-driven behaviour [110], swept on both sides.
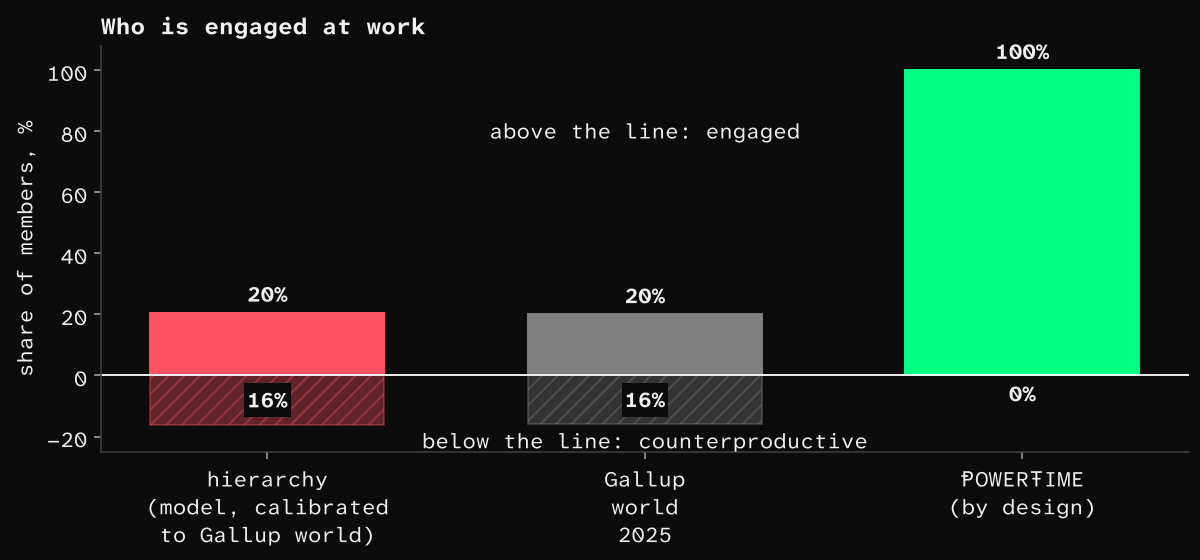
Figure 14. Share of members engaged (above the line) and counterproductive (below): a hierarchy in the model, calibrated to Gallup’s worldwide figures; Gallup’s worldwide figures for 2025; and ⱣOWERŦIME, 100% engaged by design. N = 150, mean of 20 seeds.
ⱣOWERŦIME realizes 0.96 of capacity against 0.70 for a well-run hierarchy and 0.62 for a typical one: a gain of 37% and 55%. Although output is heavy-tailed under any form, the part of the 80/20 pattern that organization causes can be recovered, and the gain goes mostly to the most capable: 26% to 78% across engagement floors. Most sensitive to: the counterproductive share (5% to 16% moves the gain from 16–22% to 37–55%); §4.7 tests the design at 90% and 80% engaged.
6.7 Admission and staffing
Does the group admit the right people, and grow the right way?
Induction and expulsion as staffing. So that a realm takes in everyone worth having and keeps no one who is not, it staffs itself with the same reviews that defend it. An induction (§5.3) admits a nominee when the panel expects them to add at least their Ŧake, an expulsion (§5.2) removes a member who no longer does, and Compensation Review (§5.1) keeps each member’s Ŧake in line with their contribution. No manager, headcount budget or hiring plan stands in between.
Admission: same five factors, different payer. Both sides score need, skill (noisy), threat (avoiding those who would outshine you) [11], likeability [9] and price, with the same weights; only the payers differ, as in §6.1. Because a newcomer’s Ŧake is set by review in proportion to contribution, ⱣOWERŦIME admits at break-even, t* in §4.3: anyone expected to add at least their pay gets in, and it fills every seat. Across 36 weightings of these factors, ⱣOWERŦIME’s admissions are 1.02 to 1.67 times as good, and the hierarchy wins at none.
Over ten periods, ⱣOWERŦIME grows by adding producers, and the hierarchy by spending budget. Managers fill their budget each period [111], ratchet it up [86, 112] and keep dead wood, whereas ⱣOWERŦIME admits every producer it finds and removes dead wood by review. With the hierarchy’s budget growing a default 3% a period, ⱣOWERŦIME’s headcount grows 160–170% against 49% (13% with no budget growth, 99% at 6% a period; Figure 15). Because ⱣOWERŦIME admits every producer who adds at least their pay, its output per head is 0.95–0.98, against 1.17 for a hierarchy that fills only its budget and takes the best of its queue. After ten periods, dead wood is 4.9–6.4% in ⱣOWERŦIME against 12.6–15.5% in a hierarchy (η from 0.5 to 1 and budget growth from 0 to 6%; Figure 16), within the measured range of 0–20% of staff flagged as underperformers (median 4%) in one practitioner dataset of 741 firms [113] and below the 15–18% of employees Gallup finds actively disengaged worldwide, an upper bound [1, 114, 115]. Most sensitive to: budget growth for the hierarchy (0 to 6% a period moves headcount growth from 13% to 99%) and η for ⱣOWERŦIME (0.5 to 1 moves dead wood from 4.9% to 6.4%).
This answers Ward’s objection. A labour-managed firm that pays equal shares and maximizes income per member should under-hire, keeping newcomers out to protect income per head [116]. ⱣOWERŦIME, however, pays each member in proportion to contribution, set by review, so a newcomer who adds at least their pay costs no one anything, and a productive hire raises the value of everyone’s Ŧ (§4.3). The value forgone by rejecting genuine producers is under 0.2% of output (0.03% at η = 1). Real cooperatives behave the same way: they adjust pay rather than employment [117, 118], are at least as productive as conventional firms [119], and are rare for reasons of capital and control rather than productivity [120].
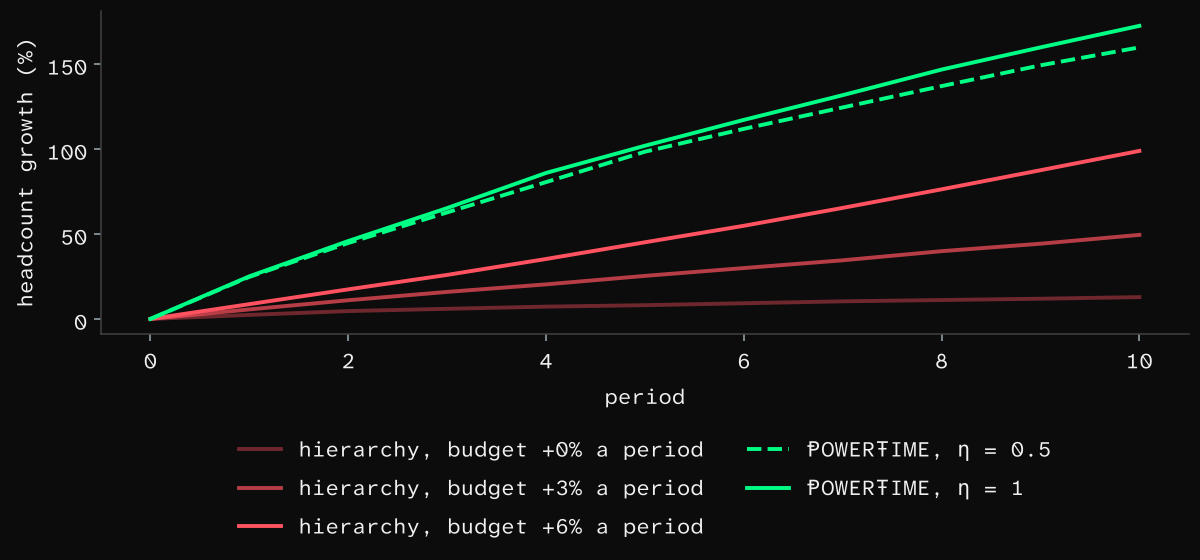
Figure 15. Headcount growth over ten periods from N = 150: hierarchies whose budget grows 0%, 3% or 6% a period, against ⱣOWERŦIME at η = 0.5 and η = 1. Hierarchy: mean of 20 seeds; ⱣOWERŦIME: mean of 12.
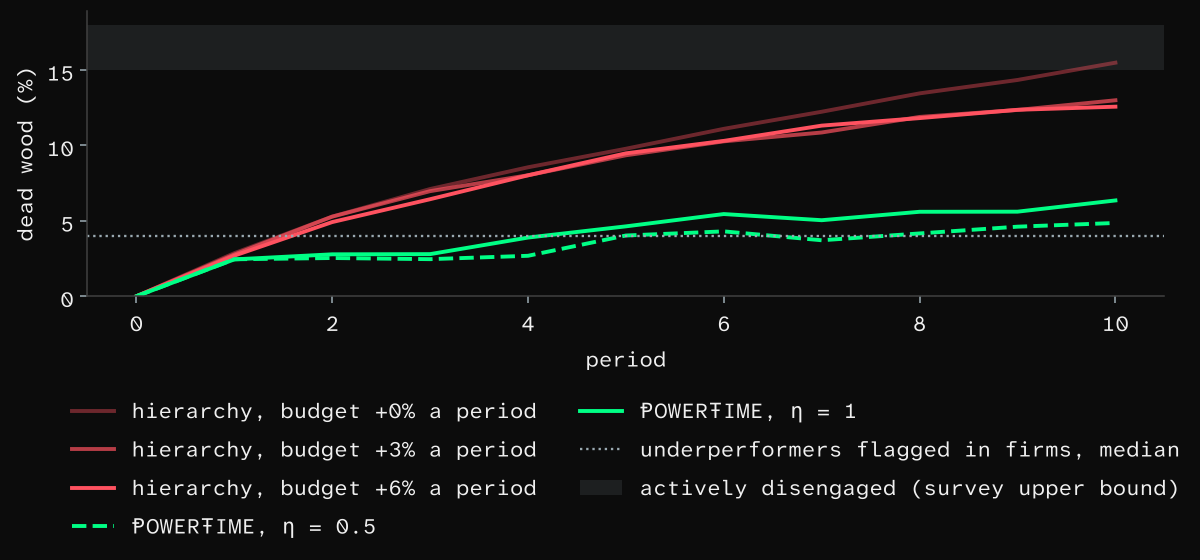
Figure 16. Dead wood (members or staff paid more than they contribute) over ten periods, same runs as Figure 15. Dotted line: median share of staff flagged as underperformers in one practitioner dataset (4%); grey band: Gallup’s actively disengaged, 15–18%, an upper bound.
6.8 Make-work
Does the group pay for work nobody needs?
Pay valued through Ŧ. So that a realm pays only for work worth having, the cost of a job and its value land on the same people. Every raise is a Compensation Review (§5.1) that all other members fund through their diluted Ŧake, and Ŧake is paid in Ŧ, the unit the realm prices its output in, so a useful job raises the value of everyone’s pay and a useless one lowers it (§4.3). No one can fund a job out of someone else’s budget.
Every job has a task value and costs one income; make-work is a job worth less than it costs. We sweep its prevalence from 5% to 40%, anchored on how many people see their own job as useless, a view that tracks alienation and poor management more than value: 4.8% in the EU in 2015, down from 7.8% in 2005 [121]; 8% across 47 countries [122]; 19% in the US, n = 1,811 [123]; 37% in the UK per YouGov, 20–50% claimed [124].
Who funds jobs? In ⱣOWERŦIME the job holder proposes their own raise in a Compensation Review, and the panel, drawn from their rings, pays for it through diluted Ŧake and gains from the job’s output through the value of Ŧ, so good jobs raise everyone’s pay and make-work lowers it. In the hierarchy, every manager above a job sponsors it, with a probability that rises with the number of people under them, since pay and status rise with span [86, 87, 125]. The chain of command approves, and the top audits the job against its task value with a probability that rises with management practices.
ⱣOWERŦIME wastes a third to two-thirds of what a hierarchy does. Net waste is 0.27–0.48%, 0.69–0.89%, 1.4–2.0% and 3.2–5.2% of the wage bill at prevalence 5%, 10%, 20% and 40%, as η runs from 0.5 to 1, against 0.83–0.97%, 1.6–1.9%, 3.5–3.9% and 7.7–9.4% for a hierarchy (Figure 17). At η = 1, ⱣOWERŦIME funds 95–97% of good jobs, against 88–94% in a hierarchy, and forgoes 0.4–2.3% of value by cutting good work, against 1.7–4.9% for a well-run hierarchy and 4.1–8.2% for a typical one; at η = 0.5 it funds 87–88% and forgoes up to 7.6%. Even a 40% bloc trading votes leaves ⱣOWERŦIME’s waste below the hierarchy’s (0.73%, 1.6%, 3.1% and 7.1% at η = 1). Most sensitive to: prevalence (5% to 40% moves ⱣOWERŦIME’s waste from 0.27–0.48% to 3.2–5.2%), then η. Administrative overhead falls with size [126, 127], so this loss tracks who decides, not how big the firm is.
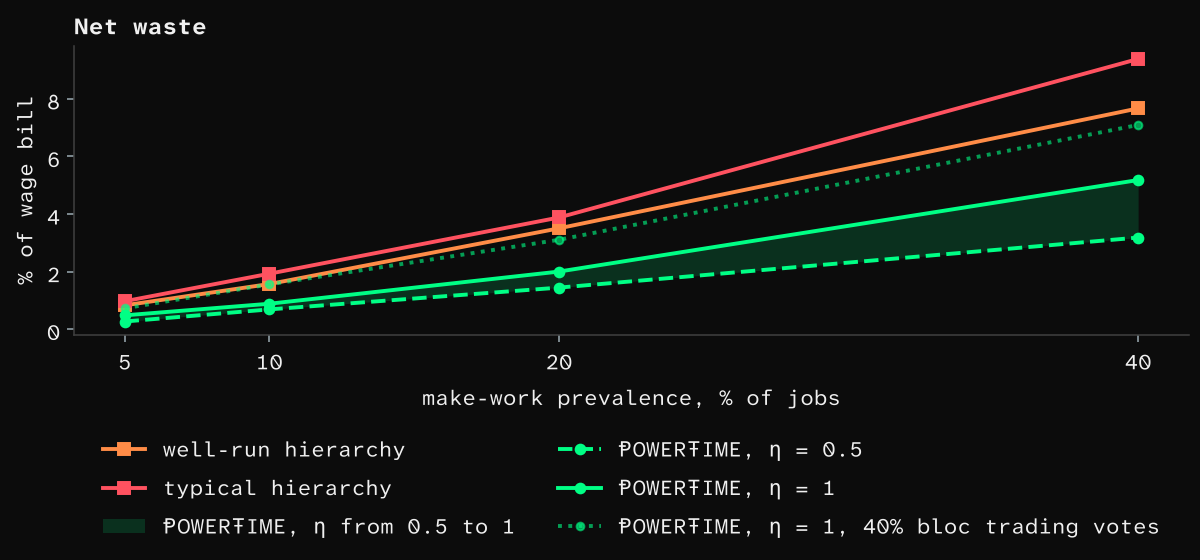
Figure 17. Net waste, as a share of the wage bill, against make-work prevalence (share of all jobs): well-run and typical hierarchies, and ⱣOWERŦIME at η = 0.5 and η = 1 (shaded: η from 0.5 to 1), plus ⱣOWERŦIME with a 40% bloc trading votes. N = 150; each point is the mean of 20 seeds.
6.9 Governance time
What does self-governance cost in hours?
The quorum ladder. So that governing takes as little of anyone’s time as it can, ⱣOWERŦIME asks for a member’s attention only where they are close to a decision, and only as much of it as the decision needs. A poll involves only the members a matter affects (§5.5), and a review is decided once a set share of its panel has voted, a share that shrinks as panels grow (§4.4). Every other panelist can sit a review out, since the people closest to the work are on the panel and will settle it, and there are no managers or scheduled appraisals to staff.
Every panel seat and vote takes time, and so do a hierarchy’s management layer, meetings and performance reviews: managers and administrators make up about 20% of the US workforce [128], about 6 hours of meetings a week for staff and 23 for managers [129], and about 31 hours a person a year on performance management [130]. Counting these on both sides, governance takes 9.0% of all hours in ⱣOWERŦIME against 22% in a hierarchy (Figure 18). Most sensitive to: the hours assumed on each side (low to high moves ⱣOWERŦIME from 4.2% to 13% and the hierarchy from 11% to 32%).
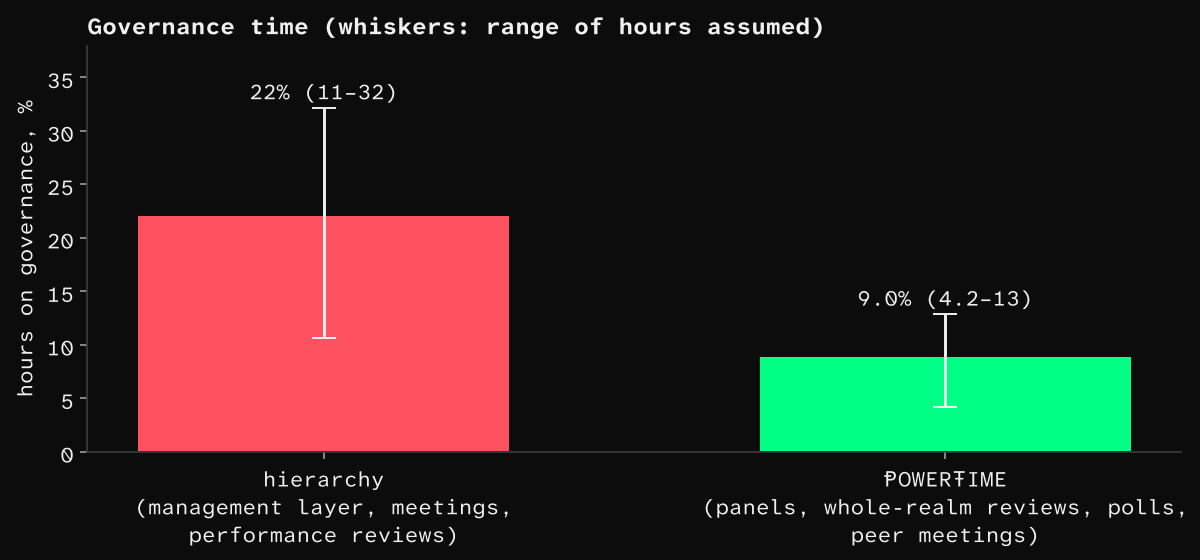
Figure 18. Share of all working hours spent on governance: a hierarchy (management layer, meetings, performance reviews) against ⱣOWERŦIME (panels, whole-realm reviews, polls, peer meetings). Bars: central estimate; whiskers: the range of hours assumed. Analytic, from the cited hours.
7. Would it win in today’s markets?
Suppose an owner cares nothing for the greatest good and only for the old metrics: profit, output per head, cost, growth, survival. Would a firm run on ⱣOWERŦIME still beat its hierarchical rivals on those? We put the productivity results of §6 on one firm’s books and ask how the answer changes with size.
The firm runs on the mechanisms above, and nothing else. Because no one in a ⱣOWERŦIME firm manages anyone, the firm adds no layers as it grows. Members choose whom they work with (§6.3), decide in write-in polls among those a matter affects (§5.5), set pay by Compensation Review (§5.1), and admit and remove members by induction and expulsion (§5.3, §5.2). Pay is each member’s Ŧake of an output priced in Ŧ (§4.3), and anyone can leave at any time (§5.4), so a firm must keep its people by paying them fairly.
Every loss is counted once, against its own target. The losses act in sequence on the same firm, each on what the previous ones left (Figure 19). Governance takes hours off production, make-work wastes part of the wage bill, and admission and dead wood set who is in the firm, counted by what they add to the firm’s total profit rather than to its output per head, since a member who adds more than their pay raises profit even when they lower the average. Decisions are scored against the true state of the market and the work, and discretionary effort against what the people doing it want, after which come loafing, disengagement and friction between partners. Most effort is required work that people give whichever way they are directed. We infer required effort near 85% from the 14–18% output gap between the most- and least-engaged units [131]; the share is our assumption, and engagement predicts task performance beyond job attitudes [106, 107]. The rest is discretionary: spent against the work, it subtracts value, and spent on something unrelated, it still carries its overhead.
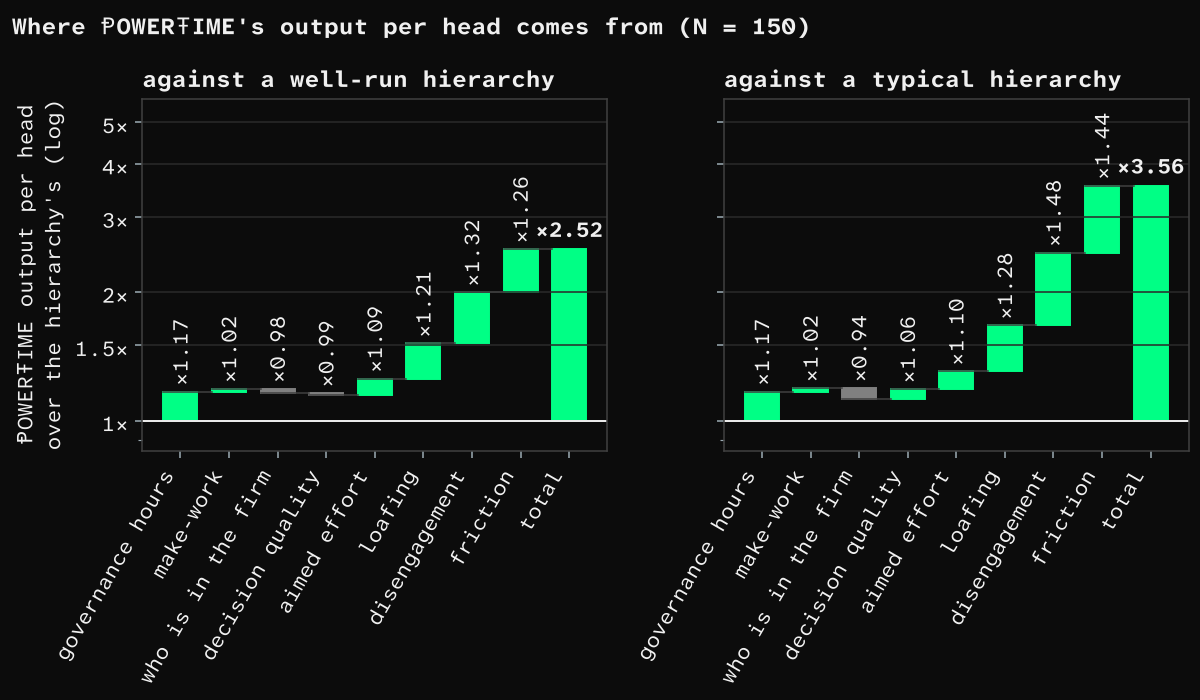
Figure 19. ⱣOWERŦIME’s output per head over a hierarchy’s at N = 150, built up loss by loss against a well-run hierarchy (left) and a typical one (right). Each step multiplies the ratio by ⱣOWERŦIME’s level divided by the hierarchy’s for that loss, from 1 to 2.5× and 3.6×; grey steps favour the hierarchy. Established firms, after ten periods; log scale.
Every layer a hierarchy adds costs it about 7% of output per head against ⱣOWERŦIME. A consultancy’s database of more than 125 large firms averages eight to nine layers of management [132], and larger firms add layers [133]. Each layer passes what frontline workers know one step further up, slanting it toward the goals of whoever it reports to, and each adds its own meetings and reporting [129, 134, 135], the coordination cost that limits how finely work can be divided [32] and sponsors its own make-work. ⱣOWERŦIME adds no layers, because every decision is taken by the members it affects, from what they observe themselves. In the model, each layer a hierarchy adds multiplies ⱣOWERŦIME’s lead by about 1.07, against a well-run and a typical hierarchy alike. An organization of 100,000 carries four more layers than one of 150, so ⱣOWERŦIME’s lead over it is 30–31% wider (relative). Summarized as a power law, the ratio of ⱣOWERŦIME’s output per head to a hierarchy’s grows with membership N as N^β with β ≈ 0.04 (0.039 against a well-run hierarchy, 95% interval 0.038–0.041; 0.041 against a typical one, 0.040–0.043), or about 3% each time membership doubles. These intervals reflect simulation noise only. Across the parameter sweep, β runs from 0.027 to 0.059 and stays positive at every setting: required effort from 65% to 92%, decision-dependent output from 15% to 40%, 1.5 to 5 points of coordination time a layer, overhead from 0 to 25% of a head’s output, and spans of 3 to 7. Most sensitive to: coordination time per layer (1.5 to 5 points moves β from about 0.027 to 0.057) and span (3 to 7 moves it from about 0.058 to 0.034). Between 150 and 100,000 people, the ratio runs from 2.5× to 3.3× against a well-run hierarchy and 3.6× to 4.7× against a typical one (Figure 20).
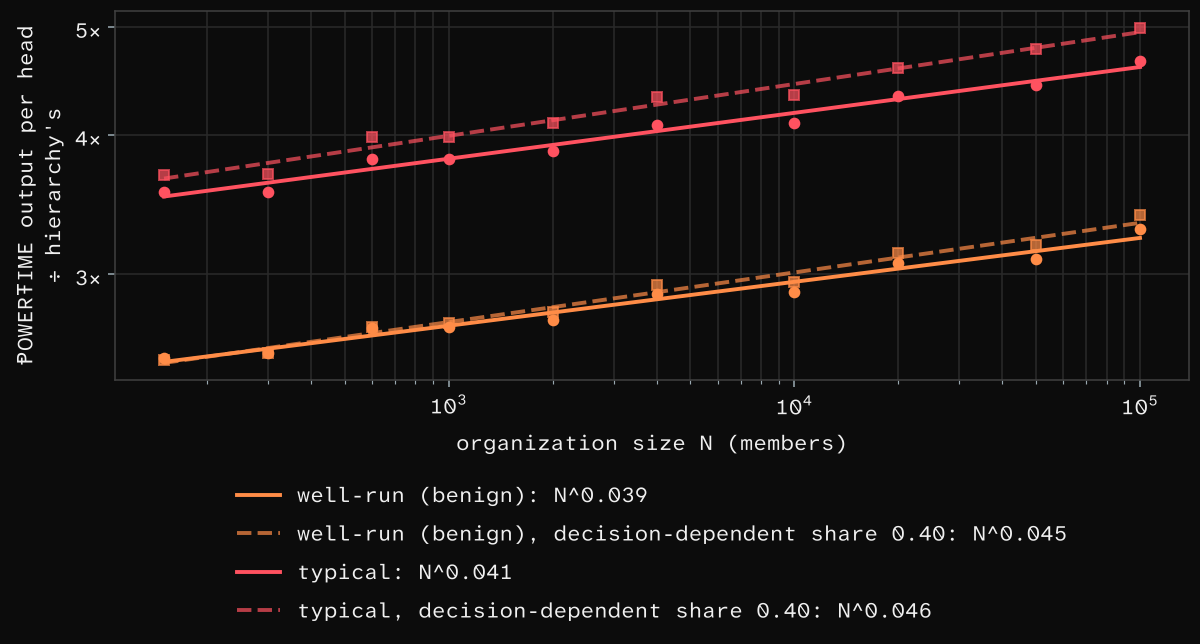
Figure 20. ⱣOWERŦIME’s output per head divided by a hierarchy’s, against organization size from 150 to 100,000 members (log scales), for well-run and typical hierarchies at the central settings (solid; points are means of 8 seeds, lines the fitted power law) and with a decision-dependent share of output of 0.40 (dashed). Span 6.5, operating margin 13%, hiring validity 0.42 / 0.19, price elasticity 6.
On the books, the gap is already large at 150. The largest difference is time: 9% of hours on governance against 22%, rising with every layer. Next come effort kept in shared work and engagement, then effort directed where members want the work to go. As a result, a ⱣOWERŦIME firm could raise everyone’s pay by 155% against a well-run rival and 260% against a typical one, 173% and 285% at 1,000 people, and still earn the 13% operating margin of an average US firm run as a hierarchy [136] (Figure 21). Staff turnover costs less too: engaged units lose a fifth to a half fewer people [131], and replacing each one costs about a fifth of a year’s pay [137].
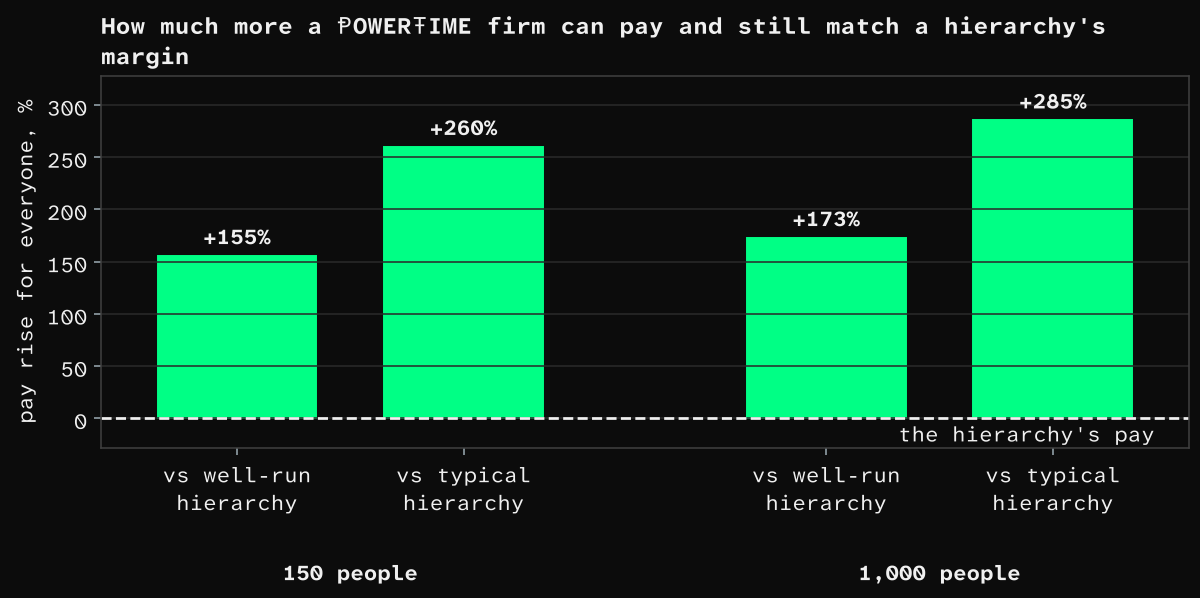
Figure 21. How much a ⱣOWERŦIME firm could raise everyone’s pay and still earn a hierarchy’s 13% operating margin, against a well-run and a typical hierarchy, at 150 and 1,000 people. From the scaling runs at the central settings.
In a market where firms come and go at historical rates, ⱣOWERŦIME firms outlast and outgrow hierarchies. We put firms of both forms in one market, where customers buy on price and quality, firms grow, shrink, exit and enter as more productive firms displace less productive ones [29, 31], and talented people move toward firms that give them a say and pay fairly; one model year equals one calendar year. Customers’ price elasticity ε measures how strongly they respond to price: at ε = 6, a 1% price cut raises a firm’s sales about 6%. We calibrate the market to US firm survival and exit rates (BLS, Census BDS) and the US firm-size distribution (SUSB) [138–140]. With hierarchies alone it reproduces how long American firms last, so the counterfactual with ⱣOWERŦIME firms starts from a world that behaves like ours. In the model, 81%, 48%, 34% and 19% of new firms survive one, five, ten and twenty years, against 79%, 49%, 34% and 20% of new US establishments; the yearly exit rate falls with age, from 17% at age one to about 6% after 25 years, as it falls from 17% to 5% for US firms (Figure 22). Acquisitions, retirements and other exits outside the model take 5.8% of firms a year on both sides alike, a rate calibrated to old-firm exit in the BDS rather than measured separately. For both forms alike, output per head falls slightly as a firm grows and the people steering it spread their attention over more work [141], so no firm takes the whole market, and the largest firms follow the upper tail of US firm sizes, a Pareto tail with an exponent near 1 [140, 142].
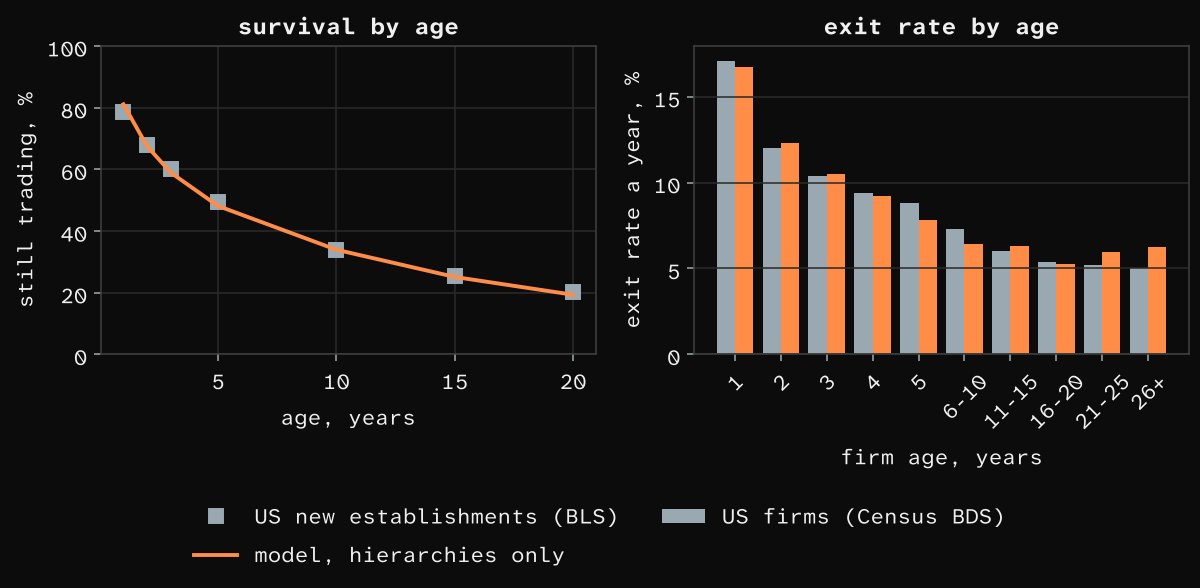
Figure 22. Calibration of the market with hierarchies only. Left: share of new firms still trading by age, the model (line) against new US establishments (squares, BLS). Right: yearly exit rate by firm age, the model against US firms (Census BDS). 500 firms, 12 seeds.
Where about a third of new firms survive ten years today, more than half of new ⱣOWERŦIME firms do. In a market of typical hierarchies where talent moves (τ = 1), 55% of new ⱣOWERŦIME firms are still trading after ten years and 30% after twenty, against 22% and 9% of new hierarchies (Figure 23). Against well-run hierarchies, new ⱣOWERŦIME firms survive at 54% and 30%, against 29% and 14%: 1.9 to 2.5 times the survival.
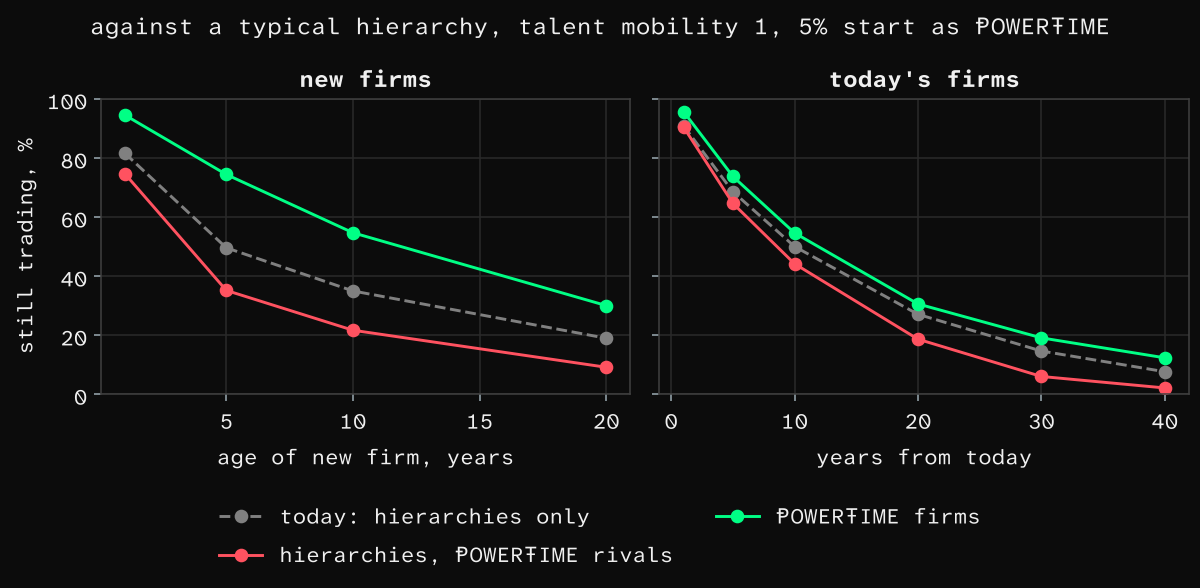
Figure 23. Survival against a typical hierarchy, talent mobility τ = 1, with 5% of firms starting as ⱣOWERŦIME. Left: new firms still trading by age: ⱣOWERŦIME firms, hierarchies facing ⱣOWERŦIME rivals, and today’s hierarchy-only market (dashed). Right: today’s firms still trading, years from today. From 48 runs.
ⱣOWERŦIME takes the market in about six years against a typical hierarchy and sixteen against a well-run one, where people can move between firms. We count the years until ⱣOWERŦIME firms hold a sustained majority: the first year from which their share of market output stays above one half to the 40-year horizon. Talent mobility τ measures how strongly people move toward firms that give them a say and pay fairly (0 = not at all). From 5% of firms at τ = 1, the median over 48 runs is 6 years against a typical hierarchy and 16 against a well-run one; from 10%, 3 and 9. Starting from 5% of firms at τ = 1, a price elasticity of 4, 5, 6 or 7 gives 11, 7, 6 and 9 years against a typical hierarchy and 29, 22, 16 and 14 years against a well-run one. At high mobility the takeover slows against a well-run hierarchy, which is under investigation (#6812).
Because each new realm raises every worker’s outside option, by year 40 (starting from 5% of firms, τ = 1) the pay markdown that hierarchies can impose falls from 19% to under 1% against typical hierarchies and to 1.7% against well-run ones, taking their margins down with it (Figure 24).
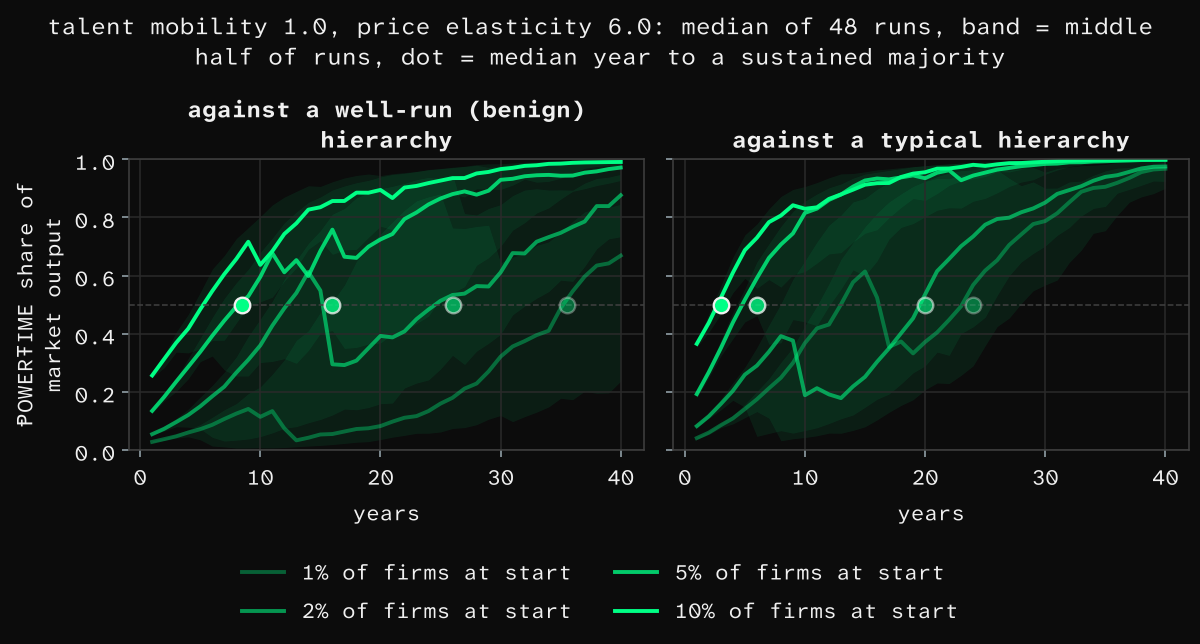
Figure 24. ⱣOWERŦIME’s share of market output over 40 years by starting share, against well-run (benign) and typical hierarchies, at talent mobility τ = 1 and price elasticity ε = 6 (a 1% price cut raises a firm’s sales about 6%). Lines: median of 48 runs; bands: the middle half of runs; dots: the median year to a sustained majority, the first year from which ⱣOWERŦIME’s share stays above one half to the horizon (a run that never gets there counts as later than 40 years). The high-mobility slowdown (#6812) is under investigation.
The real world already rewards the parts. Observational studies find co-ops and employee-owned firms survive longer [143–145], though selection may explain part of it: worker cooperatives in Uruguay are 29% less likely to dissolve than conventional firms [143], employee-owned firms are three-quarters as likely to disappear [144], and private ones half as likely to go bankrupt or close [145]. French cooperatives are as productive or more in every industry and grow as fast or faster [119]. Co-ops cut pay rather than jobs in a downturn [117, 118], and employee owners are laid off at less than half the rate of others [145]. Engagement and outcomes correlate, and the direction is contested [131, 146, 147]: across 3.35 million employees, the most engaged business units earn 23% more profit, produce 14–18% more and lose 21–51% fewer people than the least engaged [131], and firms on a best-workplaces list beat the stock market by 3.5% a year [148]. Productivity differs widely and persistently between firms [30], and management practice explains a fifth to a third of those differences [149, 150]. In one case study, self-governing Dutch nursing teams run on 8% overhead against 25% [151]. Yet each of these uses only one lever, while ⱣOWERŦIME pulls all of them at once, including the levers that grow with size, which these firms leave untouched.
Flat firms failed where ⱣOWERŦIME is built to hold. Firms that removed managers without replacing their authority saw informal hierarchy return, participation captured and power recentralized in a crisis [25, 26, 152], whereas the firm that kept its gains replaced managers with formal peer mechanisms: elected committees that set pay and a panel of six colleagues that settles disputes [153]. ⱣOWERŦIME makes that replacement complete and binding: panels drawn from the people who see the work decide pay, admission and removal, and no position lets a few decide for many.
Our prediction: firms on ⱣOWERŦIME will beat hierarchies on hierarchy’s own terms, and by more the larger they grow: more output per head, lower unit cost, higher margins, longer lives, and a rising share of every market where customers compare and talent is free to move.
8. Conclusion
ⱣOWERŦIME delivers:
- 2.5 to 4.7 times the output.
- Less work.
- Gains that grow with size.
- ⱣOWERŦIME firms produce most of the market’s output within a generation.
- 1.9 to 2.5 times the survival.
- Power no one can seize.
- Fairer pay as it spreads.
- Everyone engaged, by design.
These share one cause. In a hierarchy, the people who decide are not the people who know the work, pay for the decision or live with it, and every layer widens that gap. What frontline workers know gets lost as it passes up the chain, each manager slants what remains toward their own goals, and the organization spends its hours and wage bill managing the gap. ⱣOWERŦIME closes the gap: the people who pay for a decision make it, the people who see a member’s work judge it, and no position lets a few decide for many. The rest follows: more output from fewer hours, firms that last, and no foothold for tyranny, because there is no position to capture.
That is also why the advantage grows: while a hierarchy’s costs compound with every layer it adds, ⱣOWERŦIME adds none, so the larger the organization, the wider the margin. In a market where firms come and go at historical rates, the better-organized firm takes most of the market, within about six years against a typical hierarchy and sixteen against a well-run one.
People debate democracy against dictatorship and capitalism against socialism, but rarely does anyone offer something radically different. ⱣOWERŦIME is that: a radical update to how people organize, with good evidence that it delivers more of the greatest good, for more people, as judged by those people themselves, than hierarchy, even a well-run one.
References
- Gallup. (2026). State of the global workplace 2026. Gallup.
- Gallup. (2025). State of the world’s emotional health 2025. Gallup.
- Wellbeing Research Centre. (2026). World happiness report 2026. University of Oxford.
- Helliwell, J. F., Layard, R., Sachs, J. D., De Neve, J.-E., Aknin, L. B., & Wang, S. (Eds.). (2025). World happiness report 2025. Wellbeing Research Centre, University of Oxford.
- Edelman. (2025). 2025 Edelman trust barometer: Trust and the crisis of grievance. Edelman.
- Edelman. (2026). 2026 Edelman trust barometer: Trust amid insularity. Edelman.
- Nord, M., Altman, D., Angiolillo, F., Fernandes, T., Good God, A., & Lindberg, S. I. (2025). Democracy report 2025: 25 years of autocratization. V-Dem Institute, University of Gothenburg.
- Davies, S., Pettersson, T., Sollenberg, M., & Öberg, M. (2025). Organized violence 1989–2024, and the challenges of identifying civilian victims. Journal of Peace Research.
- Rivera, L. A. (2012). Hiring as cultural matching: The case of elite professional service firms. American Sociological Review, 77(6), 999–1022.
- Sackett, P. R., Zhang, C., Berry, C. M., & Lievens, F. (2022). Revisiting meta-analytic estimates of validity in personnel selection: Addressing systematic overcorrection for restriction of range. Journal of Applied Psychology, 107(11), 2040–2068. https://doi.org/10.1037/apl0000994
- Garcia, S. M., Song, H., & Tesser, A. (2010). Tainted recommendations: The social comparison bias. Organizational Behavior and Human Decision Processes, 113(2), 97–101.
- Benson, A., Li, D., & Shue, K. (2019). Promotions and the Peter principle. Quarterly Journal of Economics, 134(4), 2085–2134.
- Alchian, A. A., & Demsetz, H. (1972). Production, information costs, and economic organization. American Economic Review, 62(5), 777–795.
- Jensen, M. C., & Meckling, W. H. (1976). Theory of the firm: Managerial behavior, agency costs and ownership structure. Journal of Financial Economics, 3(4), 305–360.
- Shapiro, C., & Stiglitz, J. E. (1984). Equilibrium unemployment as a worker discipline device. American Economic Review, 74(3), 433–444.
- Viswesvaran, C., Ones, D. S., & Schmidt, F. L. (1996). Comparative analysis of the reliability of job performance ratings. Journal of Applied Psychology, 81(5), 557–574. https://doi.org/10.1037/0021-9010.81.5.557
- Radner, R. (1993). The organization of decentralized information processing. Econometrica, 61(5), 1109–1146.
- Fisher, C. D. (1979). Transmission of positive and negative feedback to subordinates: A laboratory investigation. Journal of Applied Psychology, 64(5), 533–540.
- Larson, J. R., Jr. (1986). Supervisors’ performance feedback to subordinates: The impact of subordinate performance valence and outcome dependence. Organizational Behavior and Human Decision Processes, 37(3), 391–408.
- Milliken, F. J., Morrison, E. W., & Hewlin, P. F. (2003). An exploratory study of employee silence: Issues that employees don’t communicate upward and why. Journal of Management Studies, 40(6), 1453–1476. https://doi.org/10.1111/1467-6486.00387
- Bloom, N., & Van Reenen, J. (2007). Measuring and explaining management practices across firms and countries. Quarterly Journal of Economics, 122(4), 1351–1408.
- Bloom, N., Eifert, B., Mahajan, A., McKenzie, D., & Roberts, J. (2013). Does management matter? Evidence from India. Quarterly Journal of Economics, 128(1), 1–51.
- Lazear, E. P., Shaw, K. L., & Stanton, C. T. (2015). The value of bosses. Journal of Labor Economics, 33(4), 823–861.
- Bloom, N., Sadun, R., & Van Reenen, J. (2012). The organization of firms across countries. Quarterly Journal of Economics, 127(4), 1663–1705.
- Lee, M. Y., & Edmondson, A. C. (2017). Self-managing organizations: Exploring the limits of less-hierarchical organizing. Research in Organizational Behavior, 37, 35–58.
- Freeman, J. (1972). The tyranny of structurelessness. Berkeley Journal of Sociology, 17, 151–164.
- Wolff, E. N. (2021). Household wealth trends in the United States, 1962 to 2019: Median wealth rebounds… but not enough (NBER Working Paper No. 28383). National Bureau of Economic Research.
- US Census Bureau. (2025). Income in the United States: 2024 (Current Population Reports P60-286). US Government Publishing Office.
- Melitz, M. J. (2003). The impact of trade on intra-industry reallocations and aggregate industry productivity. Econometrica, 71(6), 1695–1725.
- Syverson, C. (2011). What determines productivity? Journal of Economic Literature, 49(2), 326–365.
- Foster, L., Haltiwanger, J., & Syverson, C. (2008). Reallocation, firm turnover, and efficiency: Selection on productivity or profitability? American Economic Review, 98(1), 394–425.
- Becker, G. S., & Murphy, K. M. (1992). The division of labor, coordination costs, and knowledge. Quarterly Journal of Economics, 107(4), 1137–1160.
- Watts, D. J., & Strogatz, S. H. (1998). Collective dynamics of “small-world” networks. Nature, 393(6684), 440–442.
- Zhou, W.-X., Sornette, D., Hill, R. A., & Dunbar, R. I. M. (2005). Discrete hierarchical organization of social group sizes. Proceedings of the Royal Society B, 272(1561), 439–444.
- McPherson, M., Smith-Lovin, L., & Cook, J. M. (2001). Birds of a feather: Homophily in social networks. Annual Review of Sociology, 27, 415–444.
- Goel, S., Mason, W., & Watts, D. J. (2010). Real and perceived attitude agreement in social networks. Journal of Personality and Social Psychology, 99(4), 611–621.
- Alford, J. R., Hatemi, P. K., Hibbing, J. R., Martin, N. G., & Eaves, L. J. (2011). The politics of mate choice. Journal of Politics, 73(2), 362–379.
- Bakshy, E., Messing, S., & Adamic, L. A. (2015). Exposure to ideologically diverse news and opinion on Facebook. Science, 348(6239), 1130–1132.
- Shalizi, C. R., & Thomas, A. C. (2011). Homophily and contagion are generically confounded in observational social network studies. Sociological Methods & Research, 40(2), 211–239.
- Harris, M. M., & Schaubroeck, J. (1988). A meta-analysis of self-supervisor, self-peer, and peer-supervisor ratings. Personnel Psychology, 41(1), 43–62.
- Heidemeier, H., & Moser, K. (2009). Self-other agreement in job performance ratings: A meta-analytic test of a process model. Journal of Applied Psychology, 94(2), 353–370.
- O’Boyle, E., & Aguinis, H. (2012). The best and the rest: Revisiting the norm of normality of individual performance. Personnel Psychology, 65(1), 79–119.
- Holmström, B. (1982). Moral hazard in teams. Bell Journal of Economics, 13(2), 324–340.
- Füllbrunn, S., & Sadrieh, A. (2012). Sudden termination auctions: An experimental study. Journal of Economics & Management Strategy, 21(2), 519–540.
- Shubik, M. (1971). The dollar auction game: A paradox in noncooperative behavior and escalation. Journal of Conflict Resolution, 15(1), 109–111.
- Bulow, J., & Klemperer, P. (1999). The generalized war of attrition. American Economic Review, 89(1), 175–189.
- Baye, M. R., Kovenock, D., & de Vries, C. G. (1996). The all-pay auction with complete information. Economic Theory, 8(2), 291–305.
- Casella, A. (2005). Storable votes. Games and Economic Behavior, 51(2), 391–419.
- Lalley, S. P., & Weyl, E. G. (2018). Quadratic voting: How mechanism design can radicalize democracy. AEA Papers and Proceedings, 108, 33–37.
- Stigler, G. J. (1964). A theory of oligopoly. Journal of Political Economy, 72(1), 44–61.
- Selten, R. (1973). A simple model of imperfect competition, where 4 are few and 6 are many. International Journal of Game Theory, 2(1), 141–201.
- Olson, M. (1965). The logic of collective action. Harvard University Press.
- Stokes, S. C. (2005). Perverse accountability: A formal model of machine politics with evidence from Argentina. American Political Science Review, 99(3), 315–325.
- Baland, J.-M., & Robinson, J. A. (2008). Land and power: Theory and evidence from Chile. American Economic Review, 98(5), 1737–1765.
- Gneezy, U., & List, J. A. (2006). Putting behavioral economics to work: Testing for gift exchange in labor markets using field experiments. Econometrica, 74(5), 1365–1384.
- Esteves-Sorenson, C. (2018). Gift exchange in the workplace: Addressing the conflicting evidence with a careful test. Management Science, 64(9), 4365–4388.
- DellaVigna, S., List, J. A., Malmendier, U., & Rao, G. (2022). Estimating social preferences and gift exchange at work. American Economic Review, 112(3), 1038–1074.
- de Ree, J., Muralidharan, K., Pradhan, M., & Rogers, H. (2018). Double for nothing? Experimental evidence on an unconditional teacher salary increase in Indonesia. Quarterly Journal of Economics, 133(2), 993–1039.
- Lazear, E. P. (2000). Performance pay and productivity. American Economic Review, 90(5), 1346–1361.
- Shearer, B. (2004). Piece rates, fixed wages and incentives: Evidence from a field experiment. Review of Economic Studies, 71(2), 513–534.
- Burchardi, K. B., Gulesci, S., Lerva, B., & Sulaiman, M. (2019). Moral hazard: Experimental evidence from tenancy contracts. Quarterly Journal of Economics, 134(1), 281–347.
- Shaban, R. A. (1987). Testing between competing models of sharecropping. Journal of Political Economy, 95(5), 893–920.
- Jacoby, H. G., & Mansuri, G. (2009). Incentives, supervision, and sharecropper productivity. Journal of Development Economics, 88(2), 232–241.
- Akerlof, G. A., & Yellen, J. L. (1990). The fair wage-effort hypothesis and unemployment. Quarterly Journal of Economics, 105(2), 255–283.
- Kube, S., Maréchal, M. A., & Puppe, C. (2013). Do wage cuts damage work morale? Evidence from a natural field experiment. Journal of the European Economic Association, 11(4), 853–870.
- Breza, E., Kaur, S., & Shamdasani, Y. (2018). The morale effects of pay inequality. Quarterly Journal of Economics, 133(2), 611–663.
- Bassier, I., Dube, A., & Naidu, S. (2022). Monopsony in movers: The elasticity of labor supply to firm wage policies. Journal of Human Resources, 57(S), S50–S86.
- Kleven, H. J., Landais, C., & Saez, E. (2013). Taxation and international migration of superstars: Evidence from the European football market. American Economic Review, 103(5), 1892–1924.
- Moretti, E., & Wilson, D. J. (2017). The effect of state taxes on the geographical location of top earners: Evidence from star scientists. American Economic Review, 107(7), 1858–1903.
- Akcigit, U., Baslandze, S., & Stantcheva, S. (2016). Taxation and the international mobility of inventors. American Economic Review, 106(10), 2930–2981.
- Naidu, S. (2010). Recruitment restrictions and labor markets: Evidence from the postbellum U.S. South. Journal of Labor Economics, 28(2), 413–445.
- Naidu, S., & Yuchtman, N. (2013). Coercive contract enforcement: Law and the labor market in nineteenth century industrial Britain. American Economic Review, 103(1), 107–144.
- Naidu, S., Nyarko, Y., & Wang, S.-Y. (2016). Monopsony power in migrant labor markets: Evidence from the United Arab Emirates. Journal of Political Economy, 124(6), 1735–1792.
- Dube, A., Jacobs, J., Naidu, S., & Suri, S. (2020). Monopsony in online labor markets. American Economic Review: Insights, 2(1), 33–46.
- Fishback, P. V. (1986). Did coal miners “owe their souls to the company store”? Theory and evidence from the early 1900s. Journal of Economic History, 46(4), 1011–1029.
- Domar, E. D. (1970). The causes of slavery or serfdom: A hypothesis. Journal of Economic History, 30(1), 18–32.
- Starr, E., Prescott, J. J., & Bishara, N. (2021). Noncompete agreements in the US labor force. Journal of Law and Economics, 64(1), 53–84.
- Fehr, E., & Schmidt, K. M. (1999). A theory of fairness, competition, and cooperation. Quarterly Journal of Economics, 114(3), 817–868.
- Latané, B., Williams, K., & Harkins, S. (1979). Many hands make light the work: The causes and consequences of social loafing. Journal of Personality and Social Psychology, 37(6), 822–832.
- Kravitz, D. A., & Martin, B. (1986). Ringelmann rediscovered: The original article. Journal of Personality and Social Psychology, 50(5), 936–941.
- Karau, S. J., & Williams, K. D. (1993). Social loafing: A meta-analytic review and theoretical integration. Journal of Personality and Social Psychology, 65(4), 681–706.
- Ingham, A. G., Levinger, G., Graves, J., & Peckham, V. (1974). The Ringelmann effect: Studies of group size and group performance. Journal of Experimental Social Psychology, 10(4), 371–384.
- Williams, K., Harkins, S., & Latané, B. (1981). Identifiability as a deterrent to social loafing: Two cheering experiments. Journal of Personality and Social Psychology, 40(2), 303–311.
- Kerr, N. L., & Bruun, S. E. (1983). Dispensability of member effort and group motivation losses. Journal of Personality and Social Psychology, 44(1), 78–94.
- Kerr, N. L. (1983). Motivation losses in small groups: A social dilemma analysis. Journal of Personality and Social Psychology, 45(4), 819–828.
- Parkinson, C. N. (1955, November 19). Parkinson’s law. The Economist.
- Williamson, O. E. (1964). The economics of discretionary behavior. Prentice-Hall.
- Scullen, S. E., Mount, M. K., & Goff, M. (2000). Understanding the latent structure of job performance ratings. Journal of Applied Psychology, 85(6), 956–970.
- Conway, J. M., & Huffcutt, A. I. (1997). Psychometric properties of multisource performance ratings: A meta-analysis of subordinate, supervisor, peer, and self-ratings. Human Performance, 10(4), 331–360.
- Love, K. G. (1981). Comparison of peer assessment methods: Reliability, validity, friendship bias, and user reaction. Journal of Applied Psychology, 66(4), 451–457.
- Viswesvaran, C., Schmidt, F. L., & Ones, D. S. (2002). The moderating influence of job performance dimensions on convergence of supervisory and peer ratings of job performance. Journal of Applied Psychology, 87(2), 345–354.
- Rothstein, H. R. (1990). Interrater reliability of job performance ratings: Growth to asymptote level with increasing opportunity to observe. Journal of Applied Psychology, 75(3), 322–327.
- Hollander, E. P. (1965). Validity of peer nominations in predicting a distant performance criterion. Journal of Applied Psychology, 49(6), 434–438.
- Kraut, A. I. (1975). Prediction of managerial success by peer and training-staff ratings. Journal of Applied Psychology, 60(1), 14–19.
- Reilly, R. R., & Chao, G. T. (1982). Validity and fairness of some alternative employee selection procedures. Personnel Psychology, 35(1), 1–62.
- Schmidt, F. L., & Hunter, J. E. (1998). The validity and utility of selection methods in personnel psychology. Psychological Bulletin, 124(2), 262–274.
- Jawahar, I. M., & Williams, C. R. (1997). Where all the children are above average: The performance appraisal purpose effect. Personnel Psychology, 50(4), 905–925.
- Longenecker, C. O., Sims, H. P., & Gioia, D. A. (1987). Behind the mask: The politics of employee appraisal. Academy of Management Executive, 1(3), 183–193.
- Wang, X. M., Wong, K. F. E., & Kwong, J. Y. Y. (2010). The roles of rater goals and ratee performance levels in the distortion of performance ratings. Journal of Applied Psychology, 95(3), 546–561.
- Kane, J. S., & Lawler, E. E. (1978). Methods of peer assessment. Psychological Bulletin, 85(3), 555–586.
- Pier, E. L., Brauer, M., Filut, A., Kaatz, A., Raclaw, J., Nathan, M. J., Ford, C. E., & Carnes, M. (2018). Low agreement among reviewers evaluating the same NIH grant applications. Proceedings of the National Academy of Sciences, 115(12), 2952–2957.
- Moussaïd, M., Brighton, H., & Gaissmaier, W. (2015). The amplification of risk in experimental diffusion chains. Proceedings of the National Academy of Sciences, 112(18), 5631–5636. https://doi.org/10.1073/pnas.1421883112
- Rees, C., Alfes, K., & Gatenby, M. (2013). Employee voice and engagement: Connections and consequences. International Journal of Human Resource Management, 24(14), 2780–2798.
- Harter, J. (2023). U.S. employee engagement needs a rebound in 2023. Gallup. https://www.gallup.com/workplace/468233/employee-engagement-needs-rebound-2023.aspx
- Harter, J. K., Schmidt, F. L., & Hayes, T. L. (2002). Business-unit-level relationship between employee satisfaction, employee engagement, and business outcomes: A meta-analysis. Journal of Applied Psychology, 87(2), 268–279.
- Christian, M. S., Garza, A. S., & Slaughter, J. E. (2011). Work engagement: A quantitative review and test of its relations with task and contextual performance. Personnel Psychology, 64(1), 89–136. https://doi.org/10.1111/j.1744-6570.2010.01203.x
- Rich, B. L., LePine, J. A., & Crawford, E. R. (2010). Job engagement: Antecedents and effects on job performance. Academy of Management Journal, 53(3), 617–635. https://doi.org/10.5465/amj.2010.51468988
- Colquitt, J. A., Conlon, D. E., Wesson, M. J., Porter, C. O. L. H., & Ng, K. Y. (2001). Justice at the millennium: A meta-analytic review of 25 years of organizational justice research. Journal of Applied Psychology, 86(3), 425–445.
- Colquitt, J. A., Scott, B. A., Rodell, J. B., Long, D. M., Zapata, C. P., Conlon, D. E., & Wesson, M. J. (2013). Justice at the millennium, a decade later: A meta-analytic test of social exchange and affect-based perspectives. Journal of Applied Psychology, 98(2), 199–236.
- Skarlicki, D. P., & Folger, R. (1997). Retaliation in the workplace: The roles of distributive, procedural, and interactional justice. Journal of Applied Psychology, 82(3), 434–443.
- Liebman, J. B., & Mahoney, N. (2017). Do expiring budgets lead to wasteful year-end spending? Evidence from federal procurement. American Economic Review, 107(11), 3510–3549.
- Niskanen, W. A. (1971). Bureaucracy and representative government. Aldine-Atherton.
- Luc, K., & Jackson, F. (2022). 3 reasons why your employees may be underperforming [Industry source]. Culture Amp. https://www.cultureamp.com/blog/underperforming-employees
- Harter, J. (2023). Globally, employees are more engaged, and more stressed. Gallup. https://www.gallup.com/workplace/506798/globally-employees-engaged-stressed.aspx
- Gallup. (2024). State of the global workplace: 2024 report. Gallup. https://www.gallup.com/workplace/645608/state-of-the-global-workplace-2024.aspx
- Ward, B. (1958). The firm in Illyria: Market syndicalism. American Economic Review, 48(4), 566–589.
- Craig, B., & Pencavel, J. (1992). The behavior of worker cooperatives: The plywood companies of the Pacific Northwest. American Economic Review, 82(5), 1083–1105.
- Burdín, G., & Dean, A. (2009). New evidence on wages and employment in worker cooperatives compared with capitalist firms. Journal of Comparative Economics, 37(4), 517–533.
- Fakhfakh, F., Pérotin, V., & Gago, M. (2012). Productivity, capital, and labor in labor-managed and conventional firms: An investigation on French data. ILR Review, 65(4), 847–879.
- Dow, G. K. (2003). Governing the firm: Workers’ control in theory and practice. Cambridge University Press.
- Soffia, M., Wood, A. J., & Burchell, B. (2022). Alienation is not ‘bullshit’: An empirical critique of Graeber’s theory of BS jobs. Work, Employment and Society, 36(5), 816–840.
- Dur, R., & van Lent, M. (2019). Socially useless jobs. Kyklos, 72(1), 3–23.
- Walo, S. (2023). ‘Bullshit’ after all? Why people consider their jobs socially useless. Work, Employment and Society, 37(5), 1123–1146.
- Graeber, D. (2018). Bullshit jobs: A theory. Simon & Schuster.
- Jensen, M. C. (1986). Agency costs of free cash flow, corporate finance, and takeovers. American Economic Review, 76(2), 323–329.
- Pondy, L. R. (1969). Effects of size, complexity, and ownership on administrative intensity. Administrative Science Quarterly, 14(1), 47–60.
- Blau, P. M. (1970). A formal theory of differentiation in organizations. American Sociological Review, 35(2), 201–218.
- Hamel, G., & Zanini, M. (2025). Humanocracy: Creating organizations as amazing as the people inside them (Updated and expanded ed.). Harvard Business Review Press.
- Rogelberg, S. G. (2019). The surprising science of meetings. Oxford University Press.
- Buckingham, M., & Goodall, A. (2015). Reinventing performance management. Harvard Business Review, 93(4), 40–50.
- Gallup. (2024). The relationship between engagement at work and organizational outcomes: Q12 meta-analysis (11th ed.). Gallup.
- Mountain, D., & Kovac, M. (2010). How to streamline spans and layers to avoid organisational bloat [Industry source]. Bain & Company. https://www.bain.com/insights/how-to-streamline-spans-and-layers-to-avoid-organisational-bloat/
- Caliendo, L., Monte, F., & Rossi-Hansberg, E. (2015). The anatomy of French production hierarchies. Journal of Political Economy, 123(4), 809–852. https://doi.org/10.1086/681641
- Mankins, M. C., & Garton, E. (2017). Time, talent, energy. Harvard Business Review Press.
- Rogelberg, S. G. (2022). The cost of unnecessary meeting attendance [Industry source]. Otter.ai.
- Damodaran, A. (2026). Operating and net margins by industry sector (US) [Data set]. NYU Stern School of Business. https://pages.stern.nyu.edu/~adamodar/New_Home_Page/datafile/margin.html
- Boushey, H., & Glynn, S. J. (2012). There are significant business costs to replacing employees. Center for American Progress.
- US Bureau of Labor Statistics. (2026). Business employment dynamics: Establishment age and survival (Table 4, survival of private-sector establishments by opening year, cohorts 1994–2025) [Data set]. US Department of Labor.
- US Census Bureau. (2024). Business dynamics statistics: Firm exits by firm age (2023 release) [Data set].
- US Census Bureau. (2024). Statistics of U.S. businesses: 2021 SUSB annual data tables by enterprise employment size [Data set].
- Lucas, R. E., Jr. (1978). On the size distribution of business firms. Bell Journal of Economics, 9(2), 508–523.
- Axtell, R. L. (2001). Zipf distribution of U.S. firm sizes. Science, 293(5536), 1818–1820.
- Burdín, G. (2014). Are worker-managed firms more likely to fail than conventional enterprises? Evidence from Uruguay. ILR Review, 67(1), 202–238.
- Park, R., Kruse, D., & Sesil, J. (2004). Does employee ownership enhance firm survival? Advances in the Economic Analysis of Participatory and Labor-Managed Firms, 8, 3–33.
- Kruse, D. (2022). Does employee ownership improve performance? IZA World of Labor, 311(v2).
- Schneider, B., Hanges, P. J., Smith, D. B., & Salvaggio, A. N. (2003). Which comes first: Employee attitudes or organizational financial and market performance? Journal of Applied Psychology, 88(5), 836–851.
- Harter, J. K., Schmidt, F. L., Asplund, J. W., Killham, E. A., & Agrawal, S. (2010). Causal impact of employee work perceptions on the bottom line of organizations. Perspectives on Psychological Science, 5(4), 378–389.
- Edmans, A. (2011). Does the stock market fully value intangibles? Employee satisfaction and equity prices. Journal of Financial Economics, 101(3), 621–640.
- Bloom, N., Sadun, R., & Van Reenen, J. (2017). Management as a technology? (NBER Working Paper No. 22327). National Bureau of Economic Research.
- Bloom, N., Brynjolfsson, E., Foster, L., Jarmin, R., Patnaik, M., Saporta-Eksten, I., & Van Reenen, J. (2019). What drives differences in management practices? American Economic Review, 109(5), 1648–1683.
- Gray, B. H., Sarnak, D. O., & Burgers, J. S. (2015). Home care by self-governing nursing teams: The Netherlands’ Buurtzorg model. Commonwealth Fund.
- Foss, N. J., & Klein, P. G. (2022). Why managers matter: The perils of the bossless company. PublicAffairs.
- Hamel, G. (2011). First, let’s fire all the managers. Harvard Business Review, 89(12).
Reproduction
The full data package and simulation code are available on request, to be run against the ⱣOWERŦIME sandbox to reproduce any result; write to info@powertime.org.